The Psychology of Trading High-Volatility Stocks

The Psychological Dynamics of Trading High-Volatility Stocks

High-volatility stocks have a way of getting under your skin. One minute you’re watching a chart creep upward, the next minute it’s slicing through support like it’s made of paper, and you’re left wondering whether you’re a genius or just lucky. That emotional whiplash is not an accident—it’s baked into how volatile markets behave, and it directly shapes how traders think, act, and manage risk.

This article focuses on the psychological dynamics you’re likely to run into when you trade high-volatility stocks. It’s not about “keep calm and trade smarter” posters. It’s about how fear and greed show up in real decisions, how stress changes mental processing, and what practical steps can reduce damage when the market decides to be unpredictable.

The Allure of High-Volatility Stocks

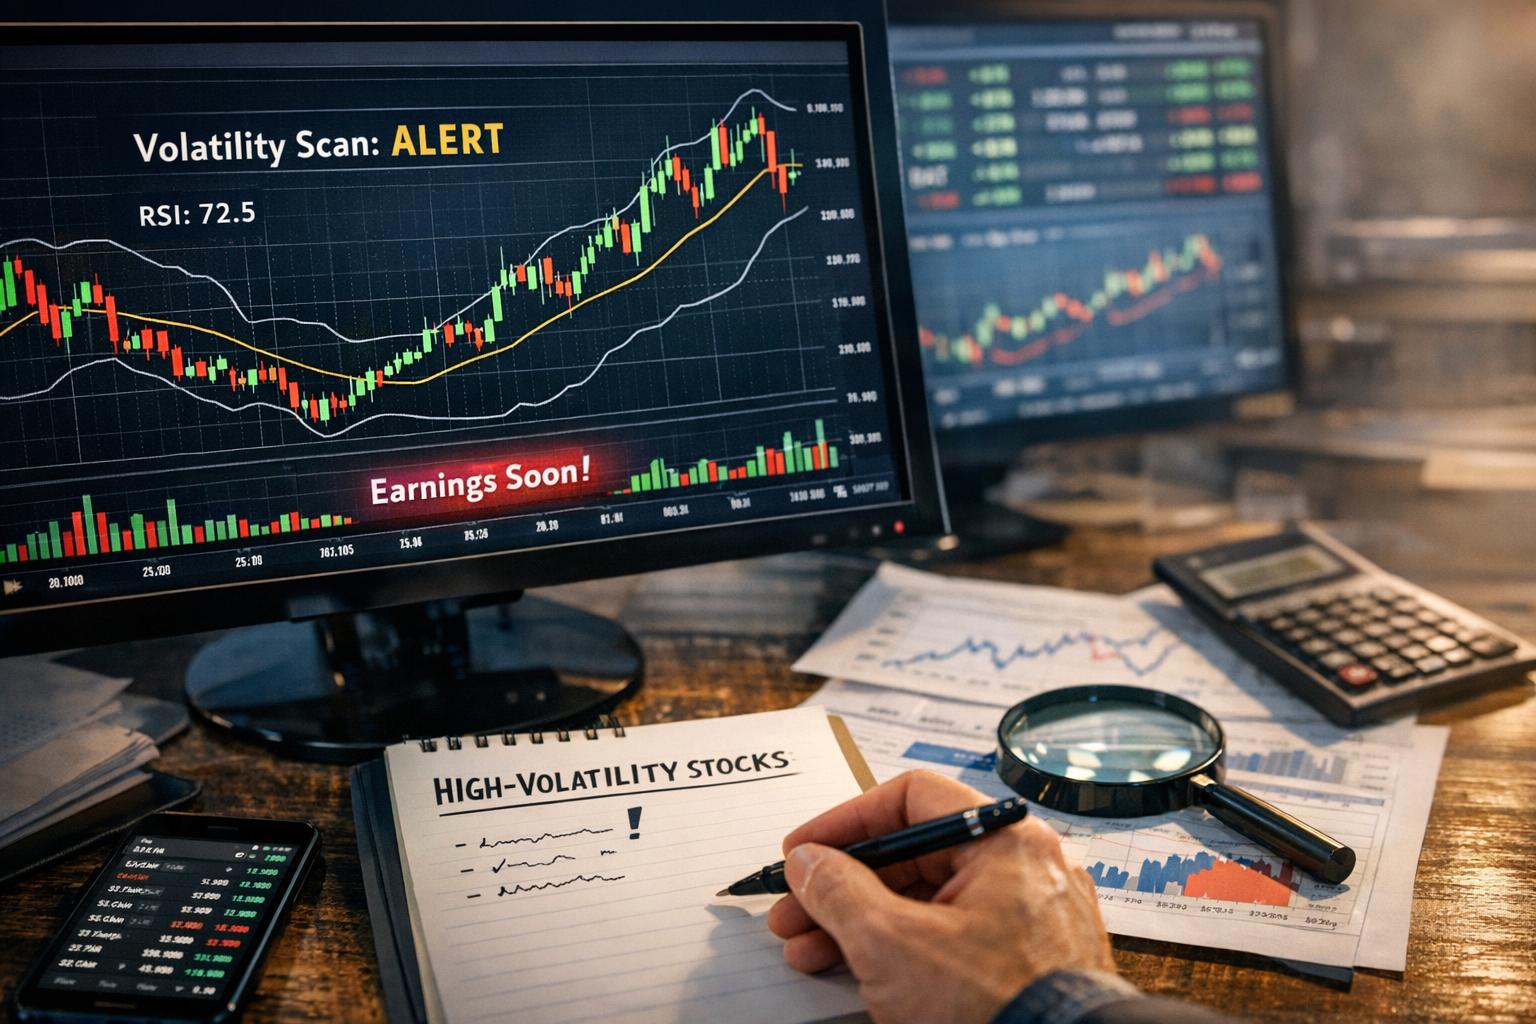
High-volatility stocks attract traders for two simple reasons: speed and magnitude. Prices can move quickly, and when they do, the potential rewards can look unusually large compared with steadier stocks.

The first thing traders notice is how fast outcomes can happen. In a high-volatility name, the distance between “small win” and “life-changing gain” can sometimes be measured in days—or even hours. That speed creates a feedback loop. You see movement, you act, movement continues, and your brain starts treating each new candle like a new test of whether you’re right.

The second thing traders notice is the possibility of dramatic gains from relatively small price changes. When implied volatility is high and order books can thin out, price swings can occur even without major long-term fundamentals shifting. That can make these stocks feel like they’re offering opportunity at every turn.

A lot of traders also get pulled in by stories. Social media and trading forums contain plenty of examples of traders who bought a volatile stock “at the right time” and got paid. Even if those stories are cherry-picked (they usually are), they still do their job: they make the possibility feel close. When you believe an outlier can happen soon, you start taking outsize risks more easily than you would in a calmer market.

Then there’s the thrill. Trading high-volatility stocks can feel like a live event. The watchlist becomes more than a spreadsheet—it becomes a scoreboard. The adrenaline comes from monitoring sudden moves, reacting to breakdowns, and getting immediate feedback. That adrenaline is fun… until it starts steering your decisions.

Psychological Challenges

Volatility doesn’t just create trading opportunities. It creates emotional pressure. When prices move fast, traders have less time to think and more time to react. And when the environment rewards frequent decisions, it also encourages frequent mistakes. You can be disciplined in quiet markets and still get wrecked in volatile ones, largely because your emotions get louder.

Fear and Greed

The two big emotions are fear and greed, and they tend to alternate rather than coexist. In practice, traders often experience them as a cycle:

– Greed shows up when a trade is working and your expectations expand.
– Fear shows up when the trade stops working and your brain starts calculating losses.

Fear of missing out (FOMO) is a common spark. High-volatility stocks move quickly, and it doesn’t take much time for a stock to rip upward without you. If you missed it, your mind starts bargaining: “If I don’t jump in now, I’ll watch the gain disappear.” That thought creates urgency, and urgency often reduces research quality.

FOMO pushes traders toward decisions with fewer checks. They may enter based on momentum alone, ignore broader market conditions, increase leverage prematurely, or skip confirming signals that they would normally wait for. Sometimes they even average down immediately, not because the plan called for it, but because the fear of “being left behind” overrides the risk logic.

On the other side, fear of loss can cause premature selling. In volatile stocks, it’s common for price to swing back and forth around your entry level. Those swings can look like “the reversal is happening” even when the broader setup is still intact. When panic kicks in, traders sell too early—often at a small loss—just to stop feeling the pain of uncertainty.

This is particularly brutal because high-volatility stocks often mean-revert in chaotic ways. A trader exits during a dip, then watches the stock recover and trend upward again. That recovery can punish the trader twice: first emotionally during the panic, and then emotionally when the “what if” replays in hindsight.

The harmful part isn’t that fear exists—it’s that fear starts directing attention. When you’re scared, you stop scanning the full situation. You focus on the part that confirms your worst-case scenario. Your brain narrows, and your decisions narrow with it.
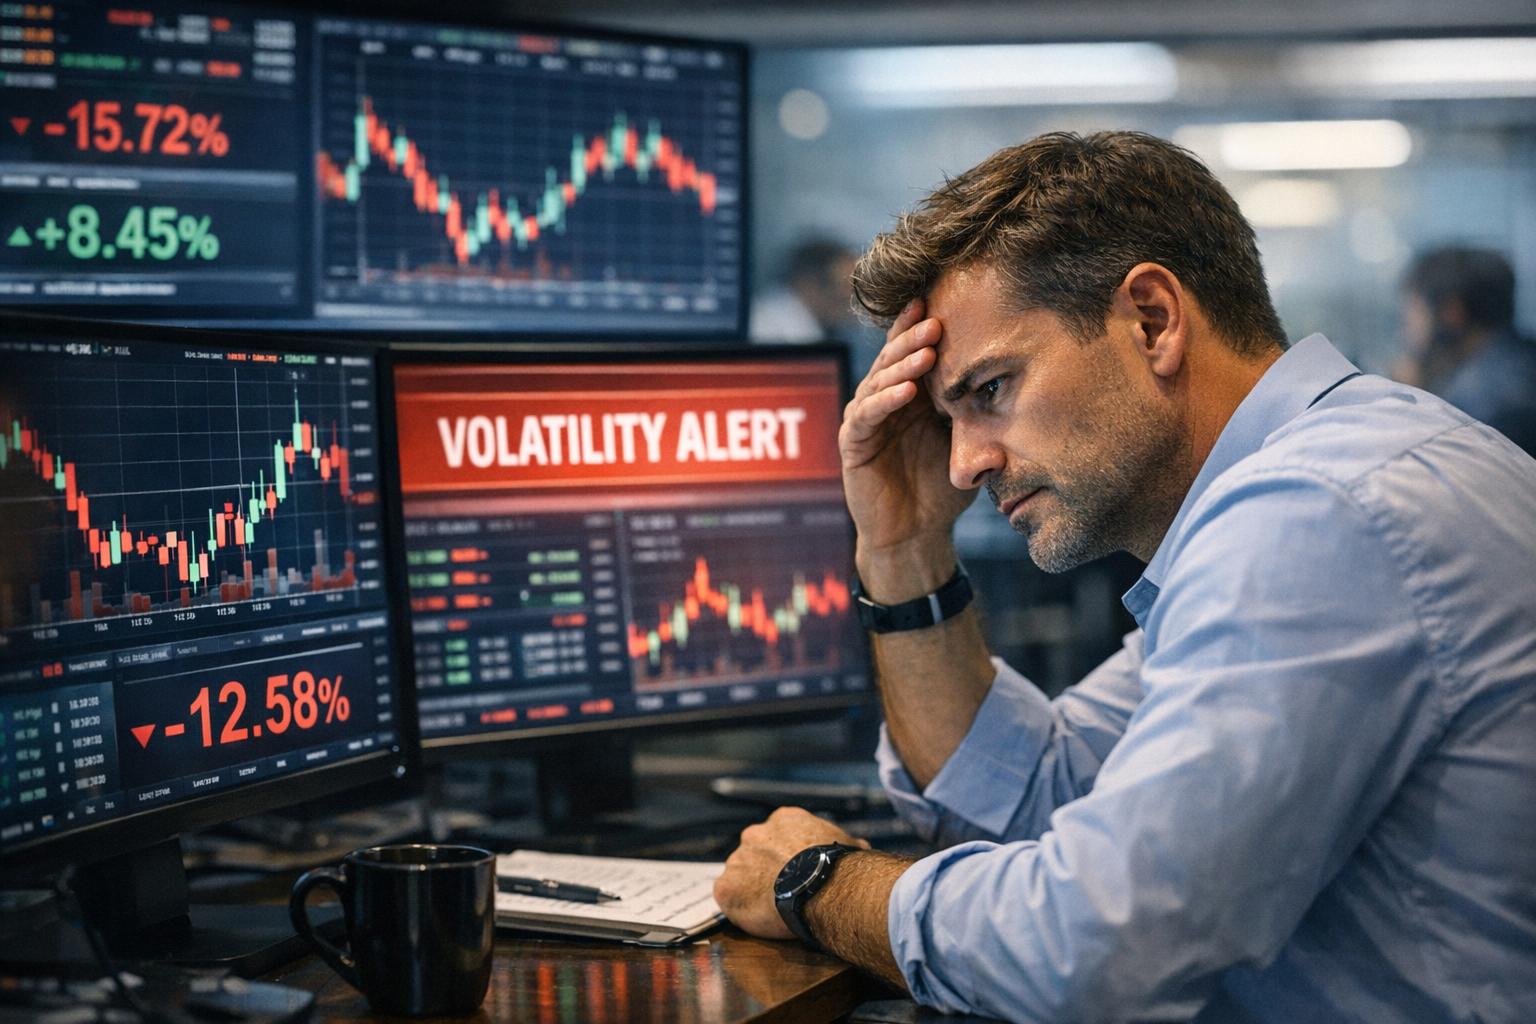
Stress and Anxiety

Stress in high-volatility trading rarely looks like a dramatic panic attack. It usually looks more boring than that: constant checking, restless thinking, and second-guessing.

There’s a mechanical reason it happens. High volatility forces faster evaluation. Price changes more often, so you update your mental model more often. If you’re checking the chart every few minutes (or every few seconds when you’re learning the hard way), your brain never gets a chance to rest.

That constant monitoring creates mental fatigue. Over time, fatigue doesn’t just slow decisions—it changes how you judge probabilities. Studies on decision-making often show that stress increases reliance on heuristics: rules of thumb. In trading, heuristics become dangerous. A common one is “if it’s going down right now, it will probably keep going down,” even though volatile markets frequently reverse.

Anxiety also makes traders more sensitive to new information. Every small move feels like confirmation that you might be wrong. As anxiety rises, you might start rewriting your thesis mid-trade. You’ll tell yourself the setup changed, even when it’s only price that changed.

And when the market can turn “against you in an instant,” the mind starts preparing for impact. That preparation looks like overtrading, reducing patience for normal pullbacks, or increasing trade size because you want the exit to happen faster. Unfortunately, bigger size can turn a manageable fluctuation into a psychological and financial problem—fast.

Common Cognitive Traps in Volatile Stocks

Even if a trader understands fear and greed in theory, real behavior can still drift because of cognitive traps. These are patterns of thinking that distort probabilities and inflate confidence.

Overtrading and the “One More Trade” Pattern

Overtrading doesn’t only happen because traders are bored. It also happens because volatile price action creates small reinforcements. You might take a quick win, then another. Each win teaches your brain that action equals progress.

But markets don’t move in a straight line, and volatile markets often produce false starts. After a few wins, the “one more trade” idea shows up. The trader isn’t just trading—he’s trying to recover momentum. If the next trade loses, the problem compounds because now the trader is trying to fix the emotional discomfort of a mistake rather than following the plan.

Anchoring to Entry Price

Anchoring is when your thoughts stick to the entry point. In high-volatility stocks, that entry price is tested repeatedly. Every time price dips below your entry, it feels like a verdict. Every time it rises back above, it feels like vindication.

That emotional labeling is expensive. Your entry price isn’t a moral identity. It’s just a point on a chart. If your setup is sound, you should focus on whether the thesis is still valid—not whether you’re “back to even” yet.

Confirmation Bias Under Pressure

Confirmation bias is common when traders feel stressed because they want certainty. You might start selecting news, volume signals, or technical indicators that support your thesis while downplaying anything that contradicts it.

In volatile markets, contradictory information is frequent, because price action is noisy. A healthy approach accepts that noise exists and sets risk rules that don’t require certainty.

Strategies to Mitigate Psychological Impact

You can’t eliminate emotion from trading. Even if you’re the calm type, the market will occasionally slap you with a move you didn’t expect. The goal is to reduce how much emotion controls your execution.

The best psychological protection usually comes from structure. The more your process is defined ahead of time, the less your brain needs to improvise when volatility spikes.

Develop a Trading Plan

A trading plan doesn’t need to be a novel. It does need to be specific enough that it can survive stress.

A good plan typically includes:
– What conditions justify entry (and what conditions invalidate it)
– Where you might exit for profit
– Where you exit if price moves against you
– How much capital you put at risk on each trade

The reason this works psychologically is simple: it creates permission to stop thinking during the trade. When you’ve already decided what signals matter, you don’t have to argue with yourself every time price flickers.

A common mistake is writing a plan that looks good on paper but doesn’t match reality. For example, a trader might say, “Buy strong momentum when trend is up,” but never define how “strong,” “momentum,” and “trend” get measured. In a volatile stock, ambiguity creates emotional space—exactly the space where fear and greed fight.

Risk Management

Risk management is not only about survival. It also reduces stress, because loss becomes predictable rather than terrifying.

Two common tools:
Position sizing: limiting how much capital you commit to a single trade
Stop-loss orders: defining a level where you exit if the trade thesis fails

Think about what happens psychologically when you don’t use stops or you oversize trades. Every fluctuation becomes a threat. Your brain doesn’t know where loss ends, so anxiety stays high.

With predefined risk, your attention shifts. You can tolerate volatility without feeling like every dip is an emergency. You still feel it, sure, but you don’t lose control of decision-making.

One practical approach is to use a fixed percentage of your account risk per trade. The number varies by trader and strategy, but the principle stays consistent: keep risk low enough that a loss doesn’t derail your next decision. If a single trade can wipe out your confidence, you’ve already lost part of the game.

However, traders should also consider that stop-loss orders can get hit in volatile moves. This is not a reason to ignore risk tools; it’s a reason to set them logically, based on the chart structure and your time horizon. A stop placed randomly is still fear dressed up as “planning.”

Pre-Trade Routine: Reduce Decision Load

In high-volatility trading, the decision load can become heavy—especially if you trade multiple times per day. A routine reduces the mental labor, which reduces anxiety.

A pre-trade routine might include:
– Check market regime (is it trending, ranging, or chaotic?)
– Confirm your setup meets your rules (not your hopes)
– Check liquidity and spread if you’re trading intraday
– Confirm your entry level and stop level match real chart levels
– Decide your maximum acceptable loss for the trade (in dollars, not vibes)

When you treat these steps like a checklist instead of a debate, you create psychological consistency. That consistency is underrated. It keeps you from improvising during stressful moments.

Continuous Learning

Confidence isn’t arrogance. It’s competence that has been tested.

Continuous learning helps because it gives you more ways to interpret price action. When you already understand how volatile stocks behave—how false breakouts happen, how volume spikes can mean different things, how news can distort technical patterns—your brain stops interpreting every move as a personal disaster.

Educational resources, workshops, and reviews of past trades can help. But the most useful learning is usually your own: after each trade, write down what you observed, what your rules said, and whether the outcome aligned with probabilities.

A quick real-world example: a trader buys a volatile stock on a breakout. It dips back below the breakout level, and they panic-sell. After reviewing, they notice they always do this when price retests the level, even though their plan says to wait for confirmation or exit at a defined stop level. That pattern means the “mistake” isn’t the trade—it’s the reaction. Learning then turns into a behavioral adjustment, not a new magical indicator.

The Role of Technology in Trading Psychology

Technology doesn’t remove risk, but it can reduce emotional errors in execution. When volatility rises, execution timing can matter. A human can hesitate; a system can follow rules.

That said, technology is only helpful if your strategy rules are clear. A vague strategy plus automation is just speed-running mistakes.

Automated Trading Systems

Automated trading systems can reduce emotional interference by executing trades based on predefined criteria. When volatility spikes, a system doesn’t panic. It doesn’t chase. It doesn’t “feel” the need to fix a mistake.

This matters because psychological errors often appear at execution. Traders don’t lose because their analysis was wrong every time. They lose because they override their rules when emotions flare.

A well-set automated system can also enforce consistency. If your plan says “enter only if condition A and B are both true,” automation can help guarantee you don’t enter on partial signals. It can also help avoid the “one more trade” behavior, because the system won’t trade outside its rules.

Of course, automated trading comes with its own risks: bugs, data issues, unexpected market gaps, slippage, and broker execution differences. Still, from a psychological standpoint, automation can be a stabilizer.

Trading Algorithms

Trading algorithms can support decision-making by analyzing patterns objectively. Technologies like data analytics and machine learning can process large amounts of historical and real-time data to identify signals.

The psychological effect is similar to automation but less rigid. Instead of executing automatically, an algorithm can help frame the decision. For instance, it might classify whether recent volatility is “mean-reverting” or “trend-driven” based on features you define.

Machine learning can also reduce confirmation bias by providing results that don’t rely on your feelings. But it’s not a crystal ball. Algorithms can overfit and fail in new market conditions. If you use algorithms, you still need risk rules. Reliability comes from testing and monitoring, not from optimism.

How to Build Emotional Resilience for Volatile Trading

Trading is partly about the numbers. It’s also about your ability to stay functional when numbers change quickly. Emotional resilience doesn’t mean “never feel.” It means you feel and still follow a process.

Use “If/Then” Rules

If/then rules translate emotional reactions into predetermined actions. Examples might include:
– “If price hits my stop, I exit immediately and do not re-enter the same day.”
– “If I break my routine checklist, I pause and wait for the next setup.”
– “If I take two losses in a row, I reduce size or stop trading for the session.”

These rules aren’t there because the trader is weak. They’re there because humans are consistent in ways that don’t always help them. If you’ve learned that stress causes you to violate rules, you can build guardrails.

Limit Watching Time

Some traders believe constant monitoring improves outcomes. Sometimes it just improves stress.

If you trade using a defined time horizon (say, swing trading rather than tick-level day trading), consider reducing real-time watching. You can check at planned intervals. In volatile stocks, the temptation is always to watch “just a bit more,” and that bit more often turns into bad decisions.

Limiting screen time can reduce anxiety and improve execution. You trade when your plan says to trade, not when your nerves say to click.

Review Trades Without Drama

Trade review should be factual, not emotional. A review process might ask:
– Did I follow my entry criteria?
– Did I set risk correctly?
– Did I exit according to rules, or did emotion take over?
– What part of the trade felt “urgent,” and did urgency cause rule violations?

When you keep reviews grounded in process, you stop treating losses as personal attacks. In high-volatility stocks, losses are often part of the deal. If you can separate outcome from process consistency, you become less reactive.

Accept That Volatility Creates “Noise Wins” and “Noise Losses”

A lot of novice traders assume they must be correct every time in volatile markets. That’s rarely true. Volatility produces random fluctuations that can make a plan look wrong in the short term—and can also produce quick wins for trades that are only partially justified.

The psychological adjustment is to judge your strategy by probability, not by the emotional meaning of the last trade. That doesn’t require blind faith. It requires tracking results over enough samples to see whether your approach holds up.

Conclusion

Trading high-volatility stocks pulls on basic human instincts: the desire to get in before the move ends, the fear of getting stuck with a loss, and the stress of making frequent decisions while price changes quickly. Those emotions aren’t the enemy by themselves. The enemy is when emotion drives execution past your plan.

By recognizing how fear and greed show up as FOMO or panic-selling, and how stress and anxiety narrow attention, traders can reduce avoidable mistakes. A well-structured trading plan helps you act with rules instead of impulses. Risk management—through position sizing and stop-loss logic—turns loss into something finite, not a looming threat that ruins judgment.

Continuous learning builds confidence the grounded way, and it also gives you a better framework for interpreting noisy price action. Finally, technology like automated trading systems and decision-support algorithms can reduce emotional interference, though they work best when your strategy is clearly defined and tested.

High-volatility trading demands more than chart reading. It demands self-awareness under pressure. Traders who take that part seriously—who build process, protect risk, and review behavior honestly—are more likely to stay consistent when the market gets loud and unpredictable.

How to Spot High-Volatility Stocks Before Major Price Movements

Understanding Volatility

In finance, volatility is the measure of how much a security’s price tends to move around over time. You can think of it as the stock’s “wiggle room.” Some stocks barely twitch; others swing like they’re trying to win an award for dramatic acting. In practical terms, volatility describes the degree of rapid increases or decreases in price, usually over short periods.

High-volatility stocks are the ones most likely to make investors sit up straighter—sometimes for profits, sometimes for regret. If you’ve ever watched a chart where the price jumps up or down hard within a day (and then repeats the stunt the next day), you’ve met volatility in the wild. For investors, the appeal is simple: rapid price movement can create trading and return opportunities. The catch is just as simple: the same movement that can produce gains can also cause losses fast.

This article focuses on how to identify high-volatility stocks, how to interpret the main indicators people use, and how to manage the risk without throwing your portfolio into a blender. (No judgment—people have tried.)

What Volatility Really Means (Beyond the Definition)

Volatility isn’t just “big price swings.” The concept has a few layers that matter when you’re evaluating stocks:

1) Magnitude
How large are the price changes relative to the stock’s usual behavior?

2) Speed
How quickly do those changes happen? A slow drift over months is different from a sudden spike within hours.

3) Predictability
Some volatility is “expected” because the market knows the stock is sensitive to news, earnings, or macro events. Other volatility appears out of nowhere and is harder to plan for.

A useful mental model is to treat volatility as a mix of market expectations plus uncertainty. When uncertainty rises, volatility often rises too. And because markets feed on uncertainty, volatility tends to cluster—once a stock starts moving violently, it can keep doing so until new information settles the issue.

Why Investors Pay Attention to Volatility

Investors don’t study volatility just because it’s interesting (though it is). They care because volatility affects:

1. Position sizing
If a stock swings widely, your “comfortable” position size usually needs to be smaller. Otherwise, normal daily moves can knock you out emotionally or financially.

2. Options pricing
Options are priced partly based on expected volatility. That means implied volatility can signal how much the market expects large moves in the near future.

3. Risk and return behavior
Two stocks can have the same long-term average return but very different risk profiles. Volatility helps describe that risk profile in numeric terms.

4. Trading opportunities
If volatility is high and liquidity is decent, traders often find more entry and exit points. But more points also means more chances to be wrong quickly, so don’t confuse “more opportunity” with “more forgiveness.”

Monitoring Market Indicators

One effective approach to identifying high-volatility stocks involves monitoring key market indicators. Indicators are useful because they summarize behavior that might otherwise be hard to spot. They don’t guarantee anything, but they help you spot candidates that are likely to move.

A quick note: no single indicator tells the full story. High volatility can be driven by liquidity changes, news cycles, sector dynamics, or company-specific events. Usually you want multiple signals aligning, not just one lonely metric waving from across the screen.

1. Beta Value: The beta value of a stock measures how sensitive its price movements are compared to the overall market. A beta greater than 1 suggests the stock has historically moved more than the market—often interpreted as “more volatile.”

However, beta comes with baggage. It’s based on past returns, and “past behavior” doesn’t always repeat. A company can mature, change strategy, or shift into a different risk profile. Also, beta can look high simply because the stock had a noisy period historically, not necessarily because it will remain that way.

If you use beta, treat it as a starting clue, not a verdict.

2. Implied Volatility: Unlike beta, implied volatility is forward-looking and comes from the options market. The options market reflects what traders expect about future price movement over a specific time horizon. High implied volatility generally indicates the market expects the security to move a lot.

Implied volatility is often quoted for different maturities (like 30 days, 90 days, and so on). That timing matters. If implied volatility spikes for near-term options, you may be watching a short-term catalyst (earnings, a regulatory decision, a product launch). If it stays elevated across longer maturities, expectations may be more structural—like a sector under stress.

It also helps to remember that implied volatility can rise even if the stock hasn’t moved much yet. In those situations, the “move” might be anticipated, not already realized.

3. Trading Volume: Trading volume indicates how many shares (or contracts) are changing hands. Spikes in trading volume can act as a signal that something is happening: new buyers and sellers are stepping in, and consensus may be shifting.

Higher volume often correlates with higher volatility because active trading tends to accompany repricing. Sometimes volume rises before the biggest move; sometimes it rises afterward as more participants pile in. In both cases, a volume jump is worth treating as a “watch closely” signal, especially when it appears around news, earnings, guidance updates, or major market events.

Qualitative Factors

Volatility is not solely a math problem. It can be driven by events and human behavior—meaning news flow, investor psychology, and corporate actions. Quantitative indicators may hint at volatility, but qualitative factors explain the “why” behind the movement.

Mergers and Acquisitions: News about potential mergers or acquisitions can cause a stock to swing because investors react to new information and then speculate about outcomes. In rumor-driven periods, uncertainty is high, so price movement can get wild. Even when deals don’t close, the trading around the announcement can still generate volatility.

Regulatory Changes: Government actions can reshape costs, timelines, and profitability assumptions for sectors. When regulators change rules—environmental standards, industry oversight, licensing requirements—markets adjust expectations rapidly. For example, environmental regulations can push up compliance costs for energy firms, and that change can show up quickly in stock prices.

Earnings Announcements: Earnings reports often act like a volatility trigger. Investors build expectations before the release, and then the reported results can force a repricing. If earnings show upside surprises or downside disappointments compared to consensus, the stock can jump or drop sharply—sometimes in the same trading session. Guidance matters too: “what we expect next quarter” often moves stocks even more than the results themselves.

These qualitative drivers are why high-volatility stocks tend to cluster around specific calendar events. If you’ve ever noticed that volatility looks calm until earnings week and then turns into a roller coaster afterward, you’ve seen the mechanism at work.

How to Tell If Volatility Is “Event-Driven” or “Structural”

This distinction matters for both traders and longer-term investors.

Event-driven volatility tends to be tied to a specific catalyst (earnings, a court decision, a contract award). Once the event passes, volatility often mean-reverts—prices may still move, but usually less violently.

Structural volatility is more tied to the company’s business model or the market conditions around it—like ongoing financial distress risk, heavy dependence on volatile commodity prices, or a sector that stays sensitive to macro changes. In those cases, volatility can persist longer because the uncertainty doesn’t go away quickly.

You can often spot which category you’re dealing with by asking: “What information would need to happen for volatility to calm down?” If the answer is “not much,” volatility is probably structural. If the answer is tied to a single upcoming event, it’s likely event-driven.

Using Technology and Tools

Manual watching is fine until it becomes exhausting. Technology can help you identify candidates faster, especially when volatility shows up in multiple metrics at once.

Stock Screeners: Stock screeners let investors filter stocks based on chosen criteria. Common filters include beta, average true range (if the screener offers it), implied volatility, trading volume changes, and recent price movement. Screeners are especially useful when you build a process instead of relying on memory.

But remember: screeners only narrow the field based on your selected criteria. If your criteria are too broad, you’ll find plenty of “noisy” stocks that don’t fit your goal. If your criteria are too narrow, you may miss opportunities. A balanced approach wins more often than an overly clever one.

Algorithmic Trading Software: Some investors use algorithmic tools to analyze large data sets and identify high-volatility behavior patterns. Algorithms can monitor price changes, liquidity metrics, options activity, and news signals. They may also manage execution based on spreads and market conditions.

This approach can be powerful, but it isn’t magic. Algorithms still need inputs that make sense, and they still carry risk if the model assumptions fail. In practice, many investors treat algorithmic tools as assistants rather than autopilots.

News Aggregators: Keeping informed of the latest developments matters because many volatility events are driven by information flow. News aggregators collect headlines and updates about companies and markets. They help you stay aware of catalysts that might not be reflected immediately in your historical volatility metrics.

If you’ve ever missed an earnings date and got surprised by a gap move, you already know why this matters. Volatility is often time-sensitive; the calendar matters.

Options Data as a “Volatility Radar”

If you trade options (or even if you just watch them), implied volatility and related options metrics can function like a radar for expected movement.

– When implied volatility rises sharply ahead of an event, the market expects bigger price swings.
– When implied volatility falls after the event, the market may be pricing in less future uncertainty.
– When realized volatility (historical movement) and implied volatility diverge, there can be opportunities—though not without risk and not without careful checking.

Some investors also look at the “skew” between call and put implied volatilities. That skew reflects perceived downside risk and can hint at how markets are positioning around bad-case scenarios.

Risk Management Considerations

High-volatility stocks can offer the chance for outsized returns, but they also increase the odds of uncomfortable drawdowns. The math of volatility is not forgiving. If you size positions too aggressively, you may get stopped out or forced to exit at the wrong time—usually the time when the stock is behaving exactly as expected.

The goal of risk management isn’t to remove risk. It’s to manage how risk affects your portfolio.

Diversification: Diversifying helps reduce the risk tied to any single high-volatility stock. If one stock moves violently against you due to a company-specific issue, the impact on the entire portfolio may be smaller. Diversification can be across sectors, strategies, and asset classes.

One caution: “diversified” doesn’t mean “immune.” If your holdings all share the same risk drivers (like interest-rate sensitivity or commodity exposure), they can still move together during market stress.

Stop-Loss Orders: Stop-loss orders can limit losses by automatically selling if a stock hits a predetermined price. This can help control downside risk and prevent a small problem from becoming a big one.

However, in high-volatility stocks, stop-loss orders can also backfire. Rapid price moves can trigger stops and cause you to exit at a temporary low, only for the stock to rebound later. Some traders use stop-losses based on volatility levels or wider thresholds to account for normal noise. Others prefer position sizing and time-based exits over hard stop orders.

In short: stop-loss orders are a tool. They should match the stock’s behavior, not fight it like a stubborn cap at a windy ballpark.

Position Sizing: The Often-Ignored Superpower

Many investors study volatility metrics but still oversize the position because the chart looks tempting. Position sizing is where volatility planning becomes real.

A simple approach is to reduce share size when volatility is higher. You can use volatility-related measures (like average percentage moves) as a guide for how much the stock might move in a typical period. If a stock can reasonably swing 3–5% daily, your position should reflect the likelihood that you’ll experience that swing while still being able to hold or execute your plan.

If that sounded a lot like common sense, it is. It’s just not always followed when excitement kicks in.

Liquidity Matters More Than People Think

High volatility with low liquidity is a rough combo. If spreads are wide or market depth is thin, you may face slippage—getting a worse execution price than expected. That can turn a “good” trade setup into a disappointing outcome simply due to execution quality.

Before you commit capital to a volatile name, check:

– Trading volume stability (not just spikes)
– Bid-ask spreads (and whether they widen significantly during news)
– Historical behavior around earnings (did the stock gap and stay there?)

Even if a stock looks volatile on paper, actual tradability determines whether you can act on that volatility.

Common Patterns in High-Volatility Stocks

If you spend enough time watching volatile names, you start to notice patterns. These patterns aren’t rules, but they can help with expectations.

1. Catalyst-driven spikes
The stock often moves hardest around events and less between events.

2. Increased correlation during market stress
When the market gets shaky, many stocks start moving together, even if their business models differ. That can increase portfolio risk beyond what you expected from individual stock analysis.

3. Volatility clustering
After big moves, volatility often stays elevated. That means traders can’t assume a “quiet period” right after a spike.

4. Options activity precedes price moves
Sometimes options traders reprice uncertainty before the stock’s price fully reacts. That can be a time-saving clue.

Practical Examples: How Investors Use Volatility in Real Life

It’s helpful to look at a few realistic scenarios to see how these concepts come together.

Example 1: Earnings week trade planning
An investor screens for stocks with rising implied volatility and elevated trading volume ahead of earnings. Beta is higher than 1, signaling market sensitivity. The investor then sizes the position smaller than usual to account for wider day-to-day movement. A stop-loss is used carefully, or the investor uses a predefined exit plan because they know gaps might occur at the open.

Example 2: Regulatory headline risk
A sector-specific stock shows increased realized volatility over the last month. It also has options implied volatility moving upward, hinting at expected future movement. The investor monitors news alerts for regulatory updates and avoids placing aggressive trades right before major regulatory milestones. When the rule change becomes clear, volatility often compresses—at least compared to the uncertainty period leading up to it.

Example 3: Deal rumor volatility
A targeted stock suddenly attracts attention after a rumor surfaces. Trading volume increases sharply, and implied volatility jumps on near-term options. The stock’s chart looks chaotic, but the investor recognizes the volatility as event-linked rather than structural. They wait for confirmation or for the rumor to fade, keeping position size conservative because outcomes are uncertain.

These examples aren’t guarantees, but they show how investors connect indicators, events, and execution decisions.

Limitations and Misinterpretations to Watch For

Volatility is useful, but people misuse it all the time—sometimes in ways that are completely understandable. If you’ve ever heard someone say “high volatility means high profit,” you’ve met the misunderstanding.

1. High volatility doesn’t automatically mean high return
It means movement risk is high. Return outcomes depend on direction, timing, valuation, and whether your trade plan matches the market’s expectations.

2. Implied volatility can stay high even when the stock goes nowhere
This can occur if uncertainty remains elevated or if the market expects volatility but direction is unclear. Options can price uncertainty without requiring an immediate large directional move.

3. Beta averages can hide recent regime changes
A stock’s risk behavior may change after a strategic shift, restructuring, or leadership change. Beta based on older data can mislead if the stock’s underlying drivers have changed.

4. Volume spikes can be misleading
Some volume spikes come from short-term speculation that fades without a long tail. It’s not automatically “institutional accumulation” or “big money incoming.”

A good rule is to treat volatility metrics as a map, not the territory. You still need to confirm what’s happening in the news and in the order flow feel of the stock.

Building a Simple Process to Identify High-Volatility Stocks

You don’t need a spreadsheet the size of a small novel. You do need consistency. A basic workflow might look like this:

1) Use a stock screener to find candidates with known volatility signals (beta, implied volatility availability, volume changes, or recent price range).
2) Verify context: check for upcoming catalysts such as earnings, major meetings, or regulatory deadlines.
3) Look at liquidity and spreads to see whether you can actually trade or monitor effectively.
4) Decide your risk plan before you enter—position size first, then the rest.
5) Track how realized volatility behaves after the event. If volatility compresses quickly, you might be dealing with event-driven risk. If it stays high, structural drivers might be in play.

This process helps you avoid the classic mistake: getting excited about volatility and skipping the “does this match my plan?” part.

Risk Controls for Different Investor Types

Not everyone approaches high-volatility stocks the same way. The right risk controls depend on whether you’re trading short-term, investing longer-term, or using options as a hedge.

Short-term traders
They often focus on near-term implied volatility, liquidity, execution quality, and tight risk rules. Time-based exits are common because markets can reverse quickly.

Long-term investors
They usually care more about whether high volatility stems from uncertainty that is likely to resolve (like a cycle) versus ongoing business instability. They might accept volatility but still control exposure through position sizing and diversification.

Options-oriented investors
They pay close attention to implied vs. realized volatility, option skews, and expiration timing. They might use volatility strategies that benefit from changes in implied volatility, not just stock direction.

No matter which bucket you’re in, volatility should never be treated as a free lunch.

When High-Volatility Stocks Make Sense

High-volatility stocks can be appropriate when you have:

– A clear catalyst timeline or a business reason to expect repricing
– Liquidity adequate for your execution needs
– A risk plan that matches the expected price movement
– Realistic expectations about how long volatility might last

They may not make sense when you’re relying on hope instead of analysis. The market has plenty of ways to humble wishful thinking.

Closing Thoughts on Identifying Volatility

Volatility is a reliable indicator of uncertainty and price movement potential. The trick is using it correctly: combining quantitative metrics like beta, implied volatility, and trading volume with qualitative awareness around earnings, regulation, and corporate actions. Then, once you identify likely high-volatility candidates, you manage risk through diversification and thoughtful exit planning.

If you want to go further, talking with a financial advisor can help you translate volatility signals into a strategy that fits your risk tolerance and goals. Volatility doesn’t judge your personality, but your portfolio consequences will.