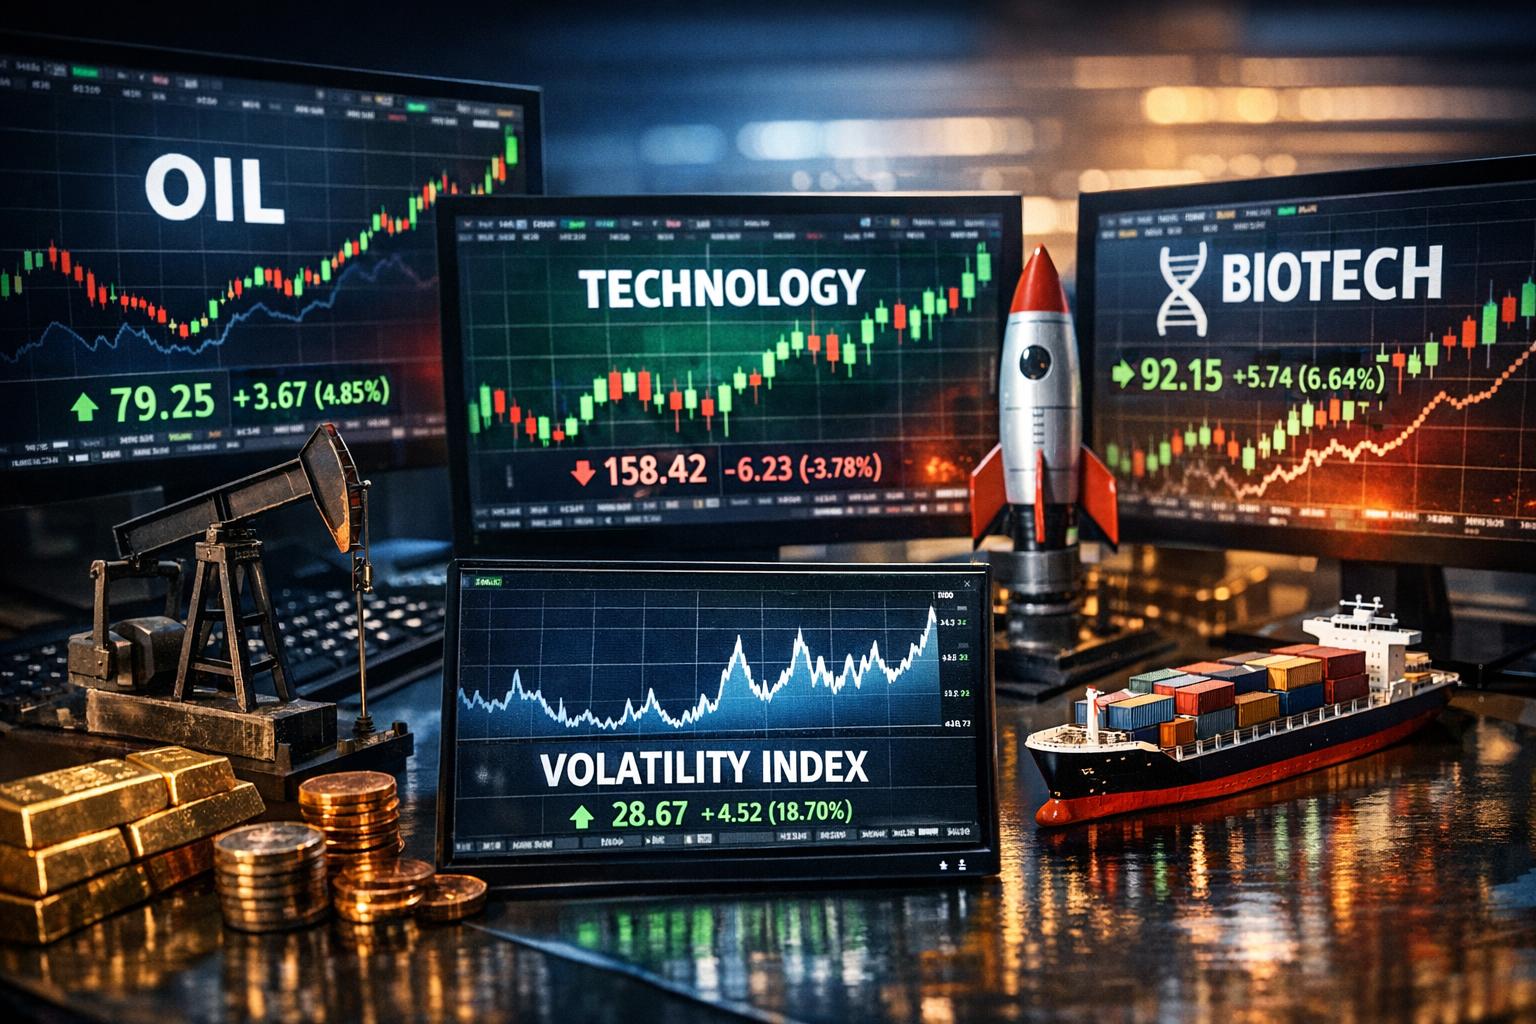
Understanding High-Volatility Stocks
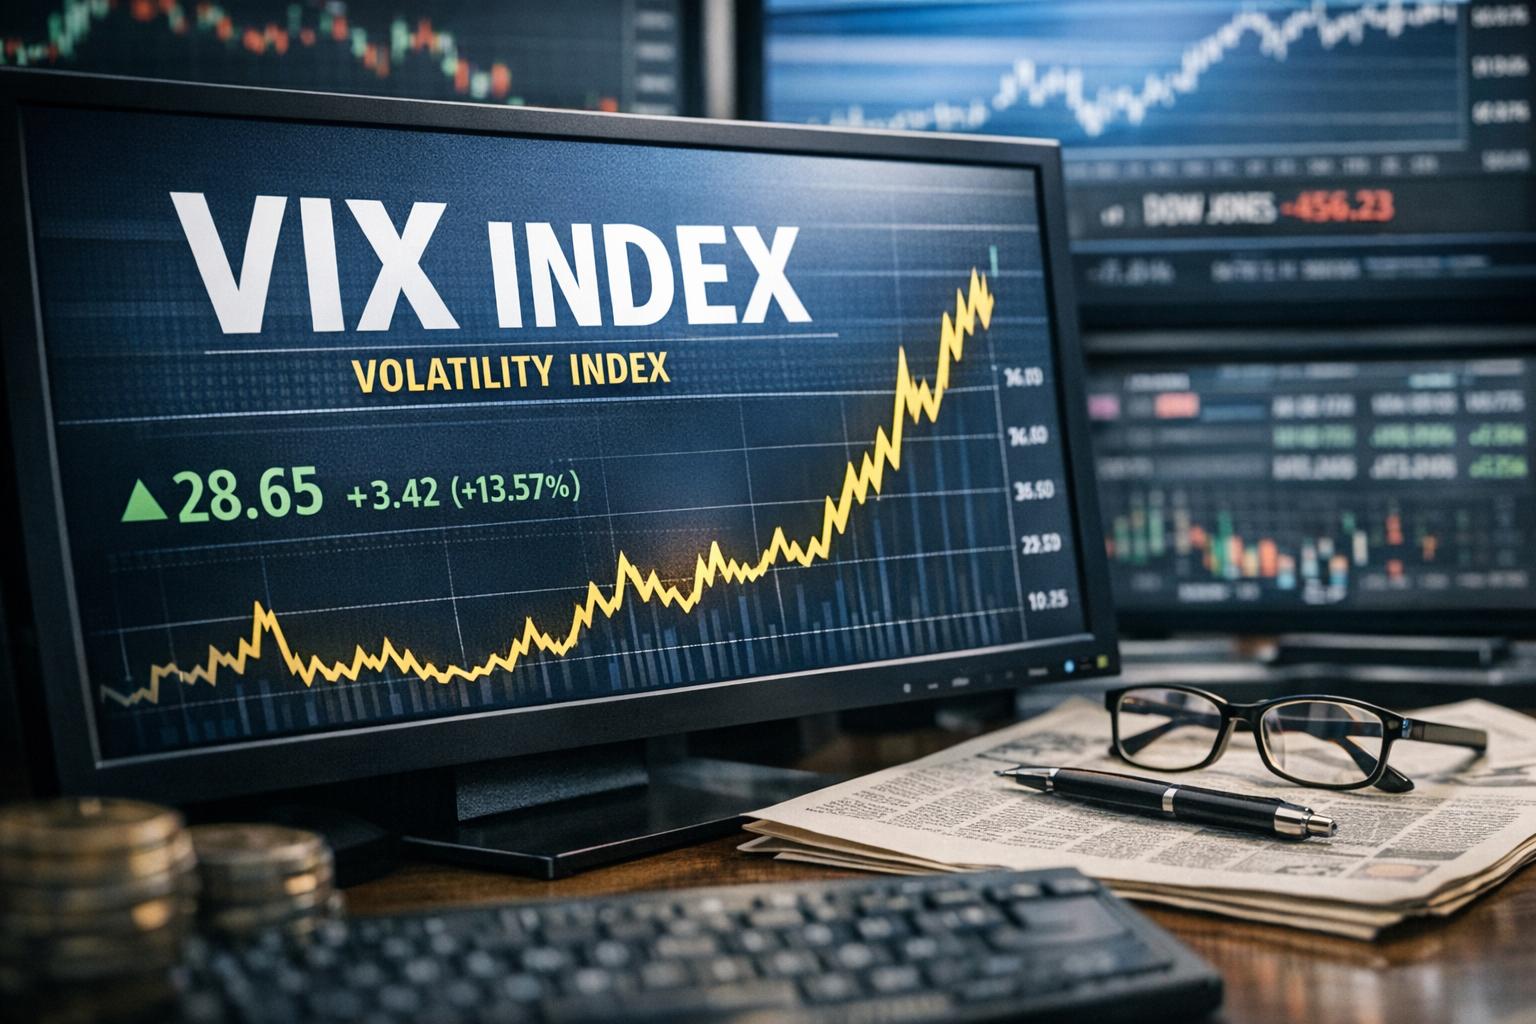
High-volatility stocks move around a lot—sometimes majestically up, sometimes unceremoniously down—often within the span of days or weeks. “High volatility” isn’t a moral judgment or a prediction that a stock will go up; it simply means the price tends to swing more than the average stock. For investors, that usually translates into two things: bigger potential gains and bigger potential shakes. If you’ve ever watched a portfolio value jump $500 and then drop $400 a few trading sessions later, congratulations, you’ve met volatility in the wild.
This article focuses on which sectors tend to contain these stocks, why those sectors behave this way, and what investors commonly miss when they try to “trade volatility” without understanding its drivers.
What “high volatility” actually means
Volatility is often measured statistically (think: standard deviation of returns). Practically, you don’t need the math to use it well. If a stock’s price fluctuates frequently and sharply, expect higher volatility. That volatility can be driven by company-specific news, broader economic forces, or both.
It’s also worth distinguishing between two common investor experiences:
- Volatility that follows fundamentals: e.g., earnings disappoint, guidance changes, trials fail or succeed. Price swings reflect new information.
- Volatility that follows sentiment: e.g., a hot product rumor, meme-driven trading, or speculative expectations. Fundamentals may not change as fast, but the stock still whipsaws.
In real markets, the lines get blurry. Still, knowing which driver dominates helps you decide whether the volatility is “informational” or “emotional.”
Why sector matters when you hunt for volatility
Some sectors are naturally prone to high-volatility stocks because their business models create frequent inflection points. Those inflection points show up as earnings surprises, regulatory outcomes, commodity price moves, product adoption news, or interest-rate sensitivity.
Sectors also differ in how much information the market processes quickly. For example, technology firms may deliver updates frequently and shift expectations fast. Biotech can swing hard on a single trial result. Banks can swing on macroeconomic changes that affect credit losses and interest margins.
So if you’re trying to understand where high-volatility stocks tend to live, it usually makes sense to start at the sector level. You then filter down to individual companies with the specific catalysts that can plausibly move the price.
Technology Sector
Technology is often the poster child for high volatility, mainly because innovation moves quickly and the market expects a constant stream of progress. Tech companies frequently operate in changing environments shaped by new inventions, shifting customer needs, and competitive disruption. When expectations change fast, stock prices do too.
Within technology, volatility can be especially pronounced in sub-sectors tied to major narratives—artificial intelligence, blockchain, cybersecurity, cloud infrastructure, semiconductors, and developer tools. These groups can see sudden repricing when there’s a breakthrough, a scaling milestone, a competitor leap, or a new regulation that changes how products can be sold.
Valuation swings happen because future growth is the product
Many tech stocks don’t just trade on today’s earnings. They often trade on beliefs about future growth: revenue trajectories, margins after scale, total addressable market, and the ability to sustain competitive advantage. That means the stock can react sharply to relatively small operational changes—because the market interprets the change as a signal about the company’s long-term path.
A simple example: a company launches a feature on schedule, it gets traction, and investors revise their growth assumptions upward. Price can surge quickly. On the flip side, a delay, a security incident, or public criticism can cause investors to question the roadmap, which can hit valuation even if the company still performs reasonably well in the short term.
Startups and Market Disruptors
Startups are often the most volatile within technology, partly because they’re still figuring things out. They may have limited revenue history, uneven cash burn, and products that evolve under real-world use. Markets sometimes reward them fast when they hit milestones, but punish them quickly when progress isn’t as smooth as investors hoped.
For investors, two realities can be uncomfortable:
- Some startups are volatile because they’re genuinely progressing.
- Some startups are volatile because they’re running out of runway or have a weak commercial plan.
Distinguishing between those two is where research matters. High volatility isn’t inherently “good” or “bad”—it’s just a signal that expectations can change quickly.
What tends to drive tech volatility in practice
Tech volatility doesn’t come out of nowhere. Common triggers include:
- Earnings and guidance: not only results, but forward-looking statements.
- Product cycles: launches, upgrades, failures, adoption rates.
- Regulatory updates: privacy rules, export controls, platform rules.
- Competitive pressure: new entrants or faster rivals.
- Supply chain and component constraints: particularly for hardware and semiconductors.
If you keep an eye on these categories, you’ll often be able to anticipate the “why” behind price swings rather than just reacting to headlines like they’re weather alerts.
Biotechnology and Pharmaceuticals
The biotechnology and pharmaceutical industries can produce some of the most dramatic volatility in the market, because so much value hinges on discrete high-stakes milestones. Drug development is slow, expensive, and full of scientific uncertainty. When uncertainty resolves—through clinical trial results or regulatory decisions—the stock often reprices sharply.
For small and mid-cap biotechs, the dependence on one or two programs can be intense. One Phase 2 or Phase 3 readout can make the difference between “promising” and “scrapped.” That concentration risk is a major reason you see big percentage moves in these names.
Drug approval and trial results aren’t “just news”—they’re repricing events
A biotech stock may trade for months with one dominant question: will the trial succeed, and will regulators approve the drug? When the answer changes, expectations jump. That can lift the stock for a while, but it can also reverse quickly if subsequent data don’t confirm the initial result, or if competitors show better efficacy.
Some investors like this volatility because it creates opportunities around known catalysts. Others avoid it because you can be right on the science and still wrong on the timeline, dosage, safety profile, or payer dynamics. Welcome to medicine: it’s complicated, because biology refuses to sign off neatly on spreadsheets.
Innovation in Drug Development
Innovation drives volatility because it changes the probability distribution of outcomes. New approaches—personalized medicine, new trial designs, improved delivery mechanisms, or next-generation biotech tools—can shift what investors think is likely to work.
However, innovation also creates new uncertainties. Better methods can reduce risk in one area while introducing new unknowns in another. That can produce whiplash if investors interpret results too optimistically or too pessimistically.
How investors typically manage biotech volatility
Common approaches include:
- Catalyst timing: buying ahead of specific trial readouts or approval decisions, with defined risk limits.
- Diversification: holding multiple programs so one failure doesn’t dominate the portfolio.
- Probability awareness: using scenarios based on trial phases and endpoints rather than treating all results as “win/lose.”
- Financing monitoring: many biotechs dilute shareholders when cash runs low, which can pressure stock regardless of clinical progress.
You don’t need to be a medical scientist to do this. You do need to read trial updates carefully and understand what endpoints actually mean—“statistically significant” isn’t always the same as “clinically meaningful,” and the market pays attention to that difference.
Energy Sector
The Energy stocks—especially oil and gas—tend to be volatile because their revenues depend heavily on external variables: commodity prices, global demand, and geopolitical disruptions. Add in the political reality of energy policy, environmental regulations, and investor reaction to long-term energy transitions, and you get a sector where prices can swing fast.
When global economic conditions improve, demand expectations often rise. That can increase oil and gas prices, lifting energy company valuations. When growth worries rise or production oversupply appears, commodity prices can fall and press margins.
Geopolitics and currencies make energy moves louder
Energy is also exposed to geopolitical risk. Conflicts in or near production regions can disrupt supply, change shipping costs, and shift pricing. Even if a specific company isn’t directly affected operationally, the market still reprices sector sentiment quickly.
Then there’s currency exposure. Many energy firms operate across borders and receive revenue in multiple currencies. If the dollar strengthens or weakens relative to currencies where they earn revenue, reported financial results can change, affecting stocks. That means energy volatility isn’t only about oil or gas—it’s also about the financial translation effects investors track.
Renewable Energy
Within the energy sector, renewable energy companies can also be very volatile, though for slightly different reasons. Renewables often depend on government incentives, subsidies, tax credits, and power purchase agreement structures. When policy changes—or when investors revise expectations about future incentives—stock prices can move sharply.
Technology shifts matter too. A new cost curve for solar panels, battery performance improvements, or grid infrastructure upgrades can strengthen or weaken business cases quickly. Investors frequently debate whether renewables will scale economically without subsidy support. That debate can make stocks swing around as new data and policy signals arrive.
Investment horizon and renewable reality
Renewable investors sometimes tolerate volatility because they believe the long-term trend is favorable. But there’s no free lunch: short-term results can be messy due to project delays, permitting issues, cost overruns, and changing financing conditions. If you’re watching renewables, it helps to look past just “headline sustainability” and focus on contract structures, backlog quality, and the pipeline of projects that can actually be delivered.
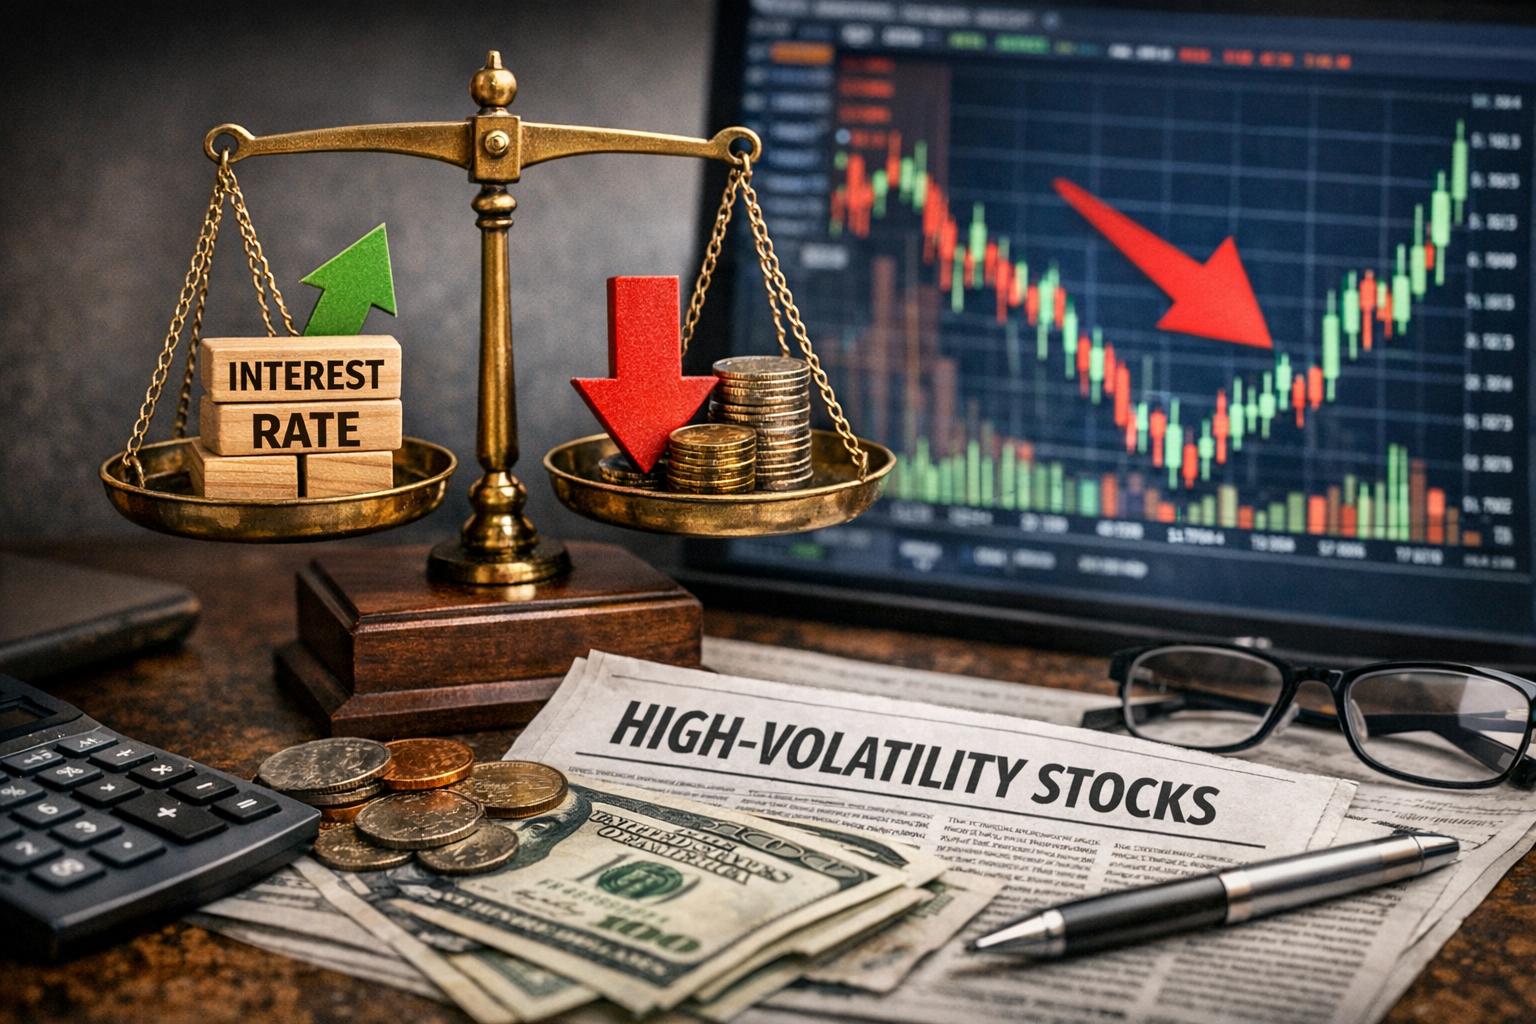
Financial Sector
The financial sector covers banking, insurance, brokerage, asset management, and more. Its volatility often relates to interest rates, credit performance, and broader economic cycles. When conditions change quickly, banks and insurers react in ways that show up in both earnings and investor sentiment.
Financial companies can appear relatively stable in calm markets because many operate with structured revenue models. But stability can vanish when credit quality deteriorates, when funding costs rise, or when economic conditions shift from “steady” to “uh-oh.”
Banking stocks
Banking stocks can show elevated volatility during economic stress or when interest rates shift quickly. The basic logic is straightforward:
- Rate changes affect net interest margins.
- Economic slowdowns affect loan defaults and charge-offs.
- Market stress can reduce fee income and increase provisions.
On top of that, banking competition matters. Fintech models can pressure traditional players by taking market share or changing expectations about digital banking features and fees. So while “banks are boring” sounds nice, the market doesn’t always reward boring. It rewards what it believes will happen next to earnings power.
Insurance and other financial sub-sectors
Insurance isn’t only about interest rates. It can swing due to catastrophe events, medical cost pressures, underwriting losses, and investment portfolio performance. Even if insurance policies are priced for risk, the market still reprices companies if it believes the risk environment changed faster than expected.
Similarly, investment brokerages and trading-focused firms can become volatile if market activity increases or drops. Volatility often becomes a measure of how investors expect capital markets to behave.
Consumer Discretionary Sector
The consumer discretionary sector includes non-essential goods and services like automotive, entertainment, travel, retail, and luxury. This sector tends to be volatile because discretionary spending is one of the first things people cut when budgets tighten. When times are good, discretionary spending expands. When times are bad, discretionary becomes “not this month.”
That makes consumer discretionary stocks sensitive to macroeconomic conditions, employment trends, consumer confidence, and supply chain realities—plus how companies position products against competitors.
Retail Segment
The retail industry segment is particularly susceptible to volatility. Retailers face relentless pressure from e-commerce competition, changing customer behavior, and inventory risk. If demand slows, inventories pile up. That can trigger discounting, lower margins, and disappointing results.
As more consumers move online, brick-and-mortar retailers can get hit harder, unless they adjust their operations. The market often swings based on questions like:
- Is the retailer gaining or losing customers online?
- How expensive is inventory this season?
- Will margins hold after promotions?
- Can the company manage logistics efficiently?
Retailers that evolve tend to exhibit lower volatility over time—less because the business becomes perfect, and more because investors feel there’s a clearer path to cash flow. Retail volatility also reflects execution risk. When companies stumble on fulfillment, tech platforms, or pricing strategy, stock prices often respond quickly.
How to spot high-volatility behavior earlier
Once you know which sectors commonly produce high-volatility stocks, the next step is figuring out which individual names show volatility characteristics that are worth your attention—and which ones are “high volatility” mostly because liquidity is thin or the company is small enough that one trade can move the price.
A few practical red flags and confirmations:
- Frequent price gaps: stocks that “jump” on news rather than moving steadily can create fast opportunities and fast regrets.
- Large swings around earnings: if performance surprises correlate strongly with price movement, volatility is likely structural.
- Upcoming catalysts: clinical trial dates, regulatory calendar items, product launch windows.
- Balance sheet sensitivity: companies that rely on external financing can become volatile when capital markets tighten.
- Commodity or rate linkage: when a stock price tracks commodity levels or interest-rate expectations closely, volatility can intensify with macro swings.
You don’t need to predict every move. You do need to know what tends to cause moves.
Risk isn’t just the downside—it’s the timing
Many investors think volatility equals risk, and volatility does carry risk. But the timing of risk matters just as much as its size.
A portfolio can survive a -20% move if it recovers quickly. It can also suffer psychologically (and financially) if drops occur when liquidity is tight or if you’re forced to sell during the worst moment. Some high-volatility stocks require patience; others punish patience.
For example, imagine two biotech companies:
- Company A has an expected trial readout in 30 days. Volatility may rise as the date approaches.
- Company B has no clear timeline and needs more trials plus financing. Volatility may keep grinding because uncertainty stays unresolved.
Same sector, different risk profile. That’s why investors often separate “event-driven volatility” from “uncertainty-driven volatility.”
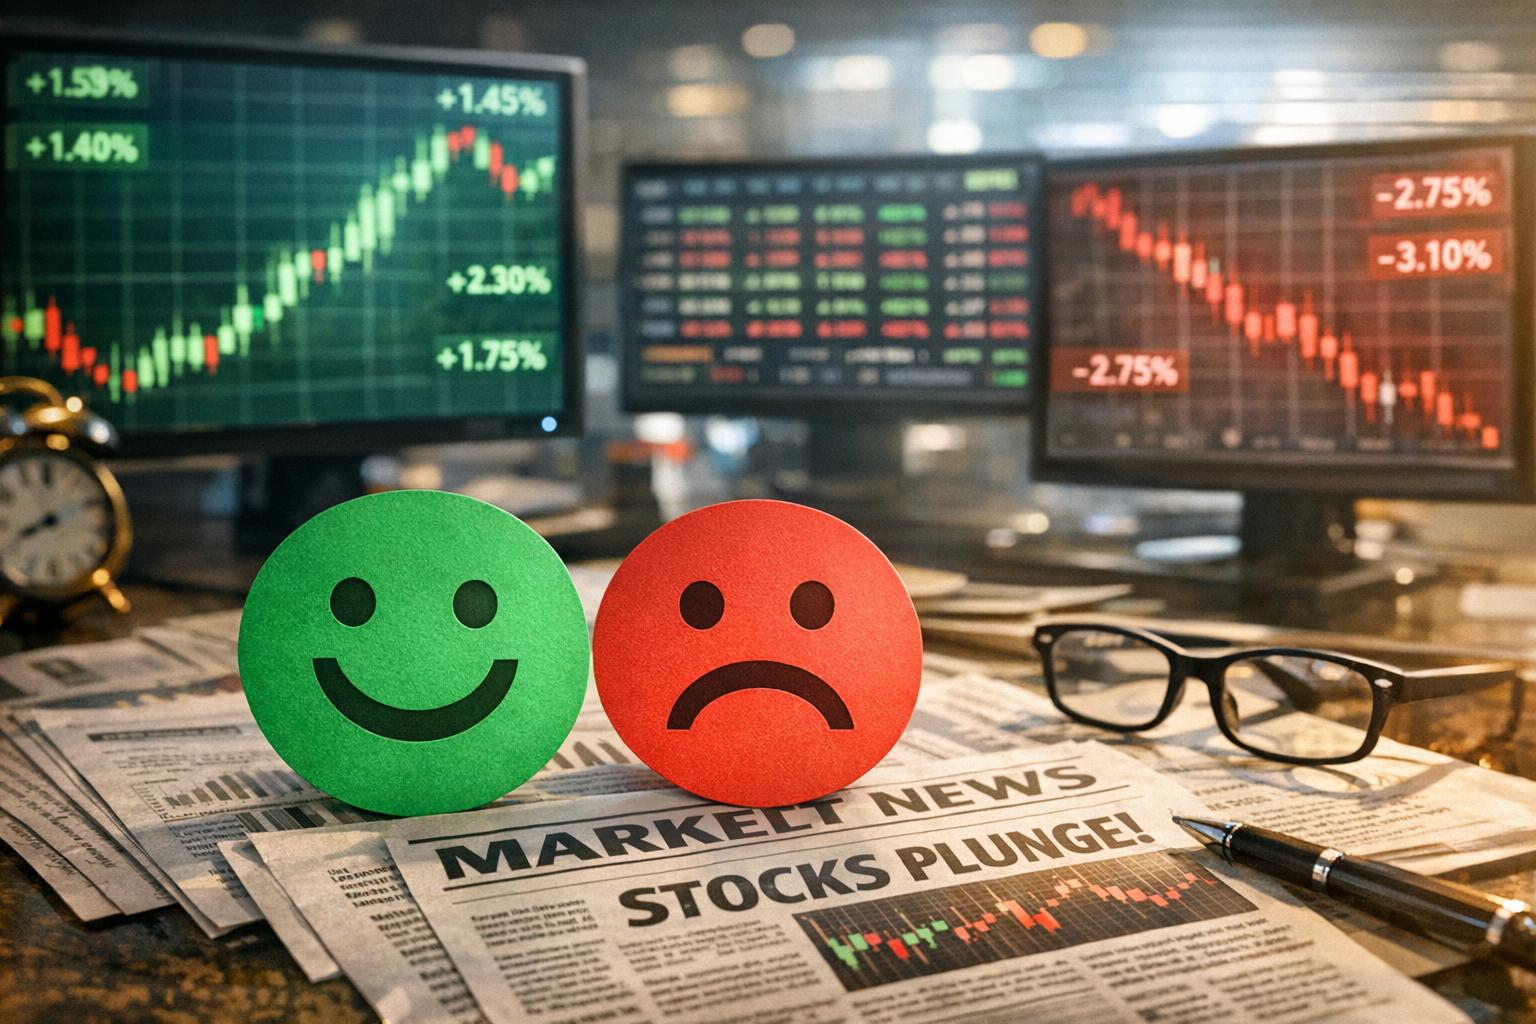
Common investor mistakes with high-volatility stocks
High-volatility sectors attract brave (or curious) investors. That’s fine. Bravery should come with checks, though. Here are mistakes that show up repeatedly:
Confusing volatility with opportunity
Volatility creates opportunity only if you can manage risk and structure your approach. If you buy a high-volatility stock because it “moves a lot,” you’re really betting on direction plus timing plus your ability to stick around.
Ignoring dilution and financing
Biotech and high-growth tech often need cash. When capital markets turn risk-off, financing becomes harder and dilution can hit shareholder value regardless of the underlying product progress. You can’t read clinical results properly if you ignore the cash clock.
Not understanding what consensus expectations are
A stock can drop even after “good” news if expectations were higher. Many high-volatility stocks are priced around specific benchmarks—trial endpoints, subscription numbers, churn rates, guidance levels, or margins. When those benchmarks miss, the stock can overshoot on the downside because the market reprices quickly.
Using a one-size-fits-all holding period
A strategy that works for trading event catalysts might fail for longer-term uncertainty resolution. If you treat every volatile stock like it’s an earnings flyer, you’ll probably end up stressed and late to the lesson.
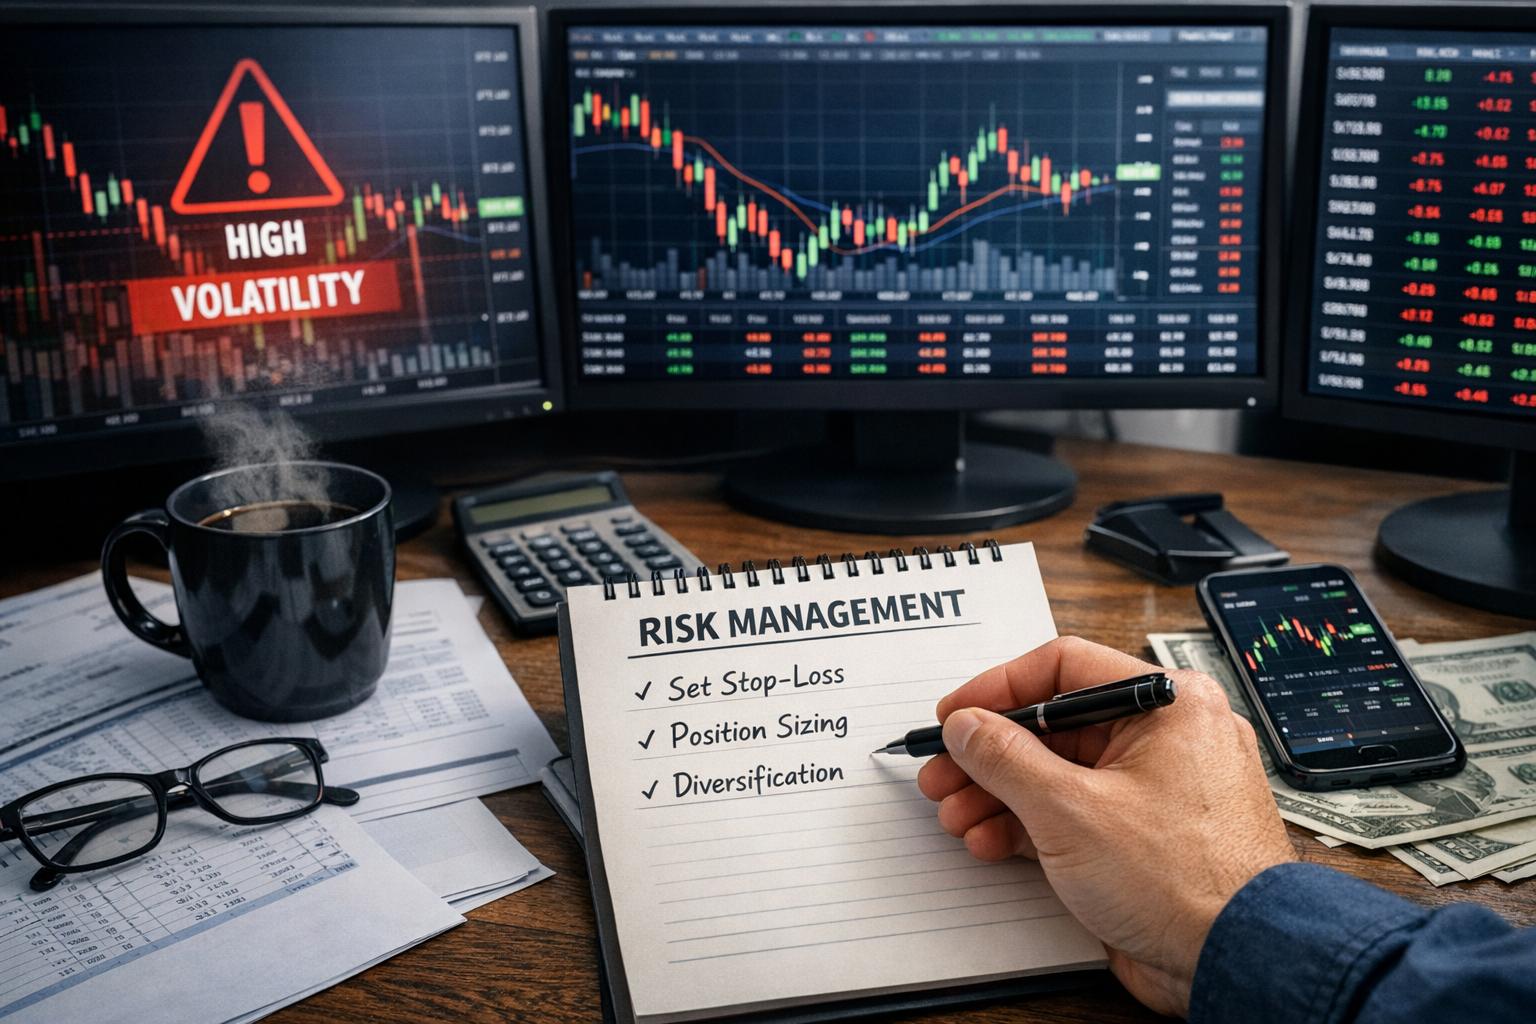
Practical ways investors can approach volatility
There are different styles of dealing with high-volatility sectors. You don’t have to copy anyone else’s playbook, but it helps to pick a method intentionally rather than by accident.
Scenario-based research instead of certainty seeking
Volatile stocks rarely offer certainty. Better practice is to map possible scenarios: success with strong adoption, success with weaker-than-expected margins, partial success with additional trials, delay or regulatory setbacks. Your goal isn’t to “find the one true answer.” Your goal is to understand what would need to be true for the stock to justify the price.
Position sizing with volatility in mind
Volatility affects position sizing. A position that feels comfortable with a stable stock can become too large when price moves swing. If you’ve ever woken up to a portfolio down 10% overnight, you know why position sizing matters. Volatility is generous with surprises.
Tax and liquidity awareness
Different investment structures have different friction. Some investors trade often, others hold for periods governed by tax rules. High-volatility stocks can also face liquidity constraints; thinly traded names can make it harder to exit on your schedule.
Monitor catalysts and “what changed”
Instead of reacting emotionally to daily moves, track what changed from the last time you checked. Did earnings guidance move? Did a clinical endpoint interpret differently? Did regulators issue a new standard? Did the market just get bored? Bored markets can still move, but they don’t move for fundamentally different reasons each time—usually.
Real-world examples of sector volatility in action
You’ve probably noticed how headlines can trigger price swings across the sectors we discussed. A few common patterns:
- Tech: a company beats revenue and updates guidance upward—shares surge. Then competition or margin pressure appears in the next report, and shares fall sharply.
- Biotech: a trial delivers positive results—shares jump and options prices spike. Later, safety concerns or follow-up data reduce enthusiasm.
- Energy: an unexpected supply disruption pushes oil prices—energy stocks react. If demand expectations weaken shortly after, the stock can reverse.
- Financial: interest-rate expectations shift—bank shares reprice rapidly. Credit default concerns can amplify the move.
- Consumer discretionary / retail: a brand misses sales expectations—discounting expectations rise, and margins get questioned.
In each case, volatility isn’t random. It’s the market shifting its probability estimates about a future that may look clearer in hindsight, but never in real time.
How to narrow down within a high-volatility sector
Once you choose the sector, you still need to find the specific candidates. That process usually comes down to five practical filters:
- Catalyst clarity: is there a known event with a timeline?
- Balance sheet strength: does the company have enough funding to survive delays?
- Sensitivity: how exposed is the stock to macro variables like rates, oil prices, or consumer demand?
- Execution: can management consistently hit milestones?
- Market expectations: is the stock priced for optimism, pessimism, or “priced for perfection”?
This doesn’t eliminate risk, but it reduces the kind of risk that comes from guesswork.
Getting comfortable with volatility without pretending it’s harmless
High-volatility stocks can reward investors who understand why the price swings happen and who can maintain discipline when the chart looks like a broken elevator.
If you’re choosing sectors, the overall pattern is consistent: technology, biotechnology/pharmaceuticals, energy (including renewables), financials, and consumer discretionary often contain high-volatility names. Within each sector, the reasons differ—innovation cycles, trial and regulatory outcomes, commodity geopolitics, interest rates and credit quality, and consumer spending habits.
And here’s the part investors usually learn the hard way: volatility doesn’t guarantee profits. It guarantees movement. If you’re ready to manage that movement—through research, scenario planning, and position sizing—then high-volatility sectors can become a place where your homework pays off faster than your feelings.
Final thoughts
Investors seeking high-volatility stocks should consider sectors like technology, biotechnology, energy, financial, and consumer discretionary, each offering different ways for prices to swing and different types of risk to monitor. Conduct thorough research before committing capital, track the specific drivers behind each move, and be honest about your time horizon and risk tolerance. Volatility can create real opportunities, but only when you treat it as information—not as a casino signal.