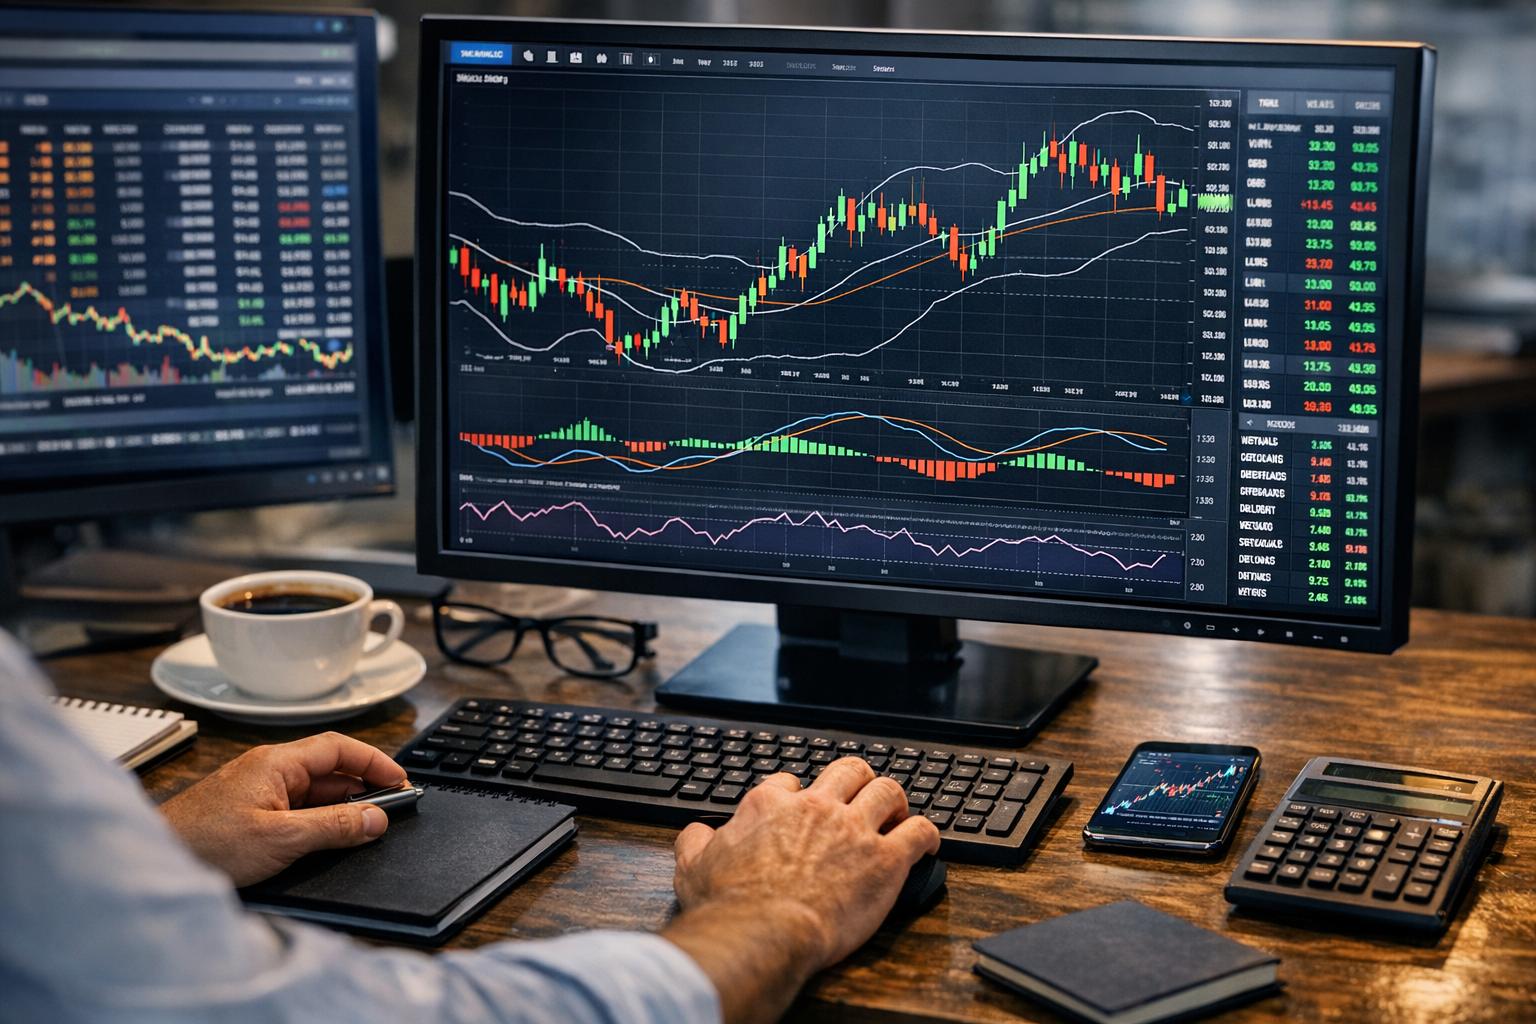
The Importance of Stop-Loss and Take-Profit Orders
If you’ve ever watched a high-volatility stock swing hard in a single session, you’ll know the feeling: one minute it’s acting like it’s made of rocket fuel, the next it’s slipping like it forgot its own parachute. That’s the reality of markets where price moves fast and emotions can move faster.
Stop-loss and take-profit orders are two of the simplest tools traders and investors have to impose structure on that chaos. They help you define “what happens next” before the market gets a chance to bully your decision-making. The goal isn’t to predict the future perfectly. The goal is to manage risk, reduce emotional trading, and automate exits so you don’t have to watch every tick.
In this article, we’ll break down what stop-loss and take-profit orders do, how to set them in a realistic way, what can go wrong (because it can), and how to use them together without turning your trading plan into a guess-and-hope ritual.
Understanding Stop-Loss Orders
A stop-loss order is an instruction to sell a security when it reaches a specific price. The purpose is plain: limit losses if the trade goes against you.
In high-volatility stocks, price can gap down, spike intraday, or reverse sharply on news. Without a stop-loss, a position can drift lower after your entry until it’s far outside what you meant to risk. With a stop-loss, you’re telling the market: “If things go wrong, exit now—no drama.”
A common way to describe a stop-loss is as an automated safety rail. If the stock hits your stop price, your broker triggers the sell (or at least attempts to, depending on the order type). That’s the part many newer traders underestimate: the stop-loss isn’t a guarantee of an exact price, but it is a guard against staying in a losing trade indefinitely.
How a Stop-Loss Works in Practice
Let’s say an investor buys a stock at $100. They might decide they can tolerate a 5% decline. They set a stop-loss at $95. If the stock trades down to $95, the order triggers and the system sells according to the stop-loss rules.
The important point is behavior: you’re not waiting for “maybe it comes back.” You predefine the level where the trade thesis is no longer working—at least, not in a way that matches your risk tolerance.
Benefits of Stop-Loss Orders
Stop-loss orders offer a few benefits that are both practical and psychological:
1) Risk management that doesn’t rely on willpower
When markets move fast, discipline can get expensive. A stop-loss removes some of the “I’ll just watch it for a bit longer” temptation.
2) Fewer oversized losses
One of the biggest reasons accounts blow up isn’t that traders take losses—it’s that they take them too large, too slowly. Stops can help keep losses consistent with the plan.
3) Less emotion in exits
It’s hard to stay calm when a position is watching you sweat. With a predefined stop, you reduce the number of decisions that occur while your brain is occupied by stress.
4) More repeatable trading
A plan you can execute repeatedly beats a plan you “feel” out each time. Stops help you maintain consistency, especially across multiple trades.
What Stop-Loss Orders Can’t Do
It’s also worth saying what stop-loss orders do not do. They are not a magic force field.
If a stock is extremely volatile, or if it gaps, the executed sale price may be worse than your stop price. That can happen for a few reasons:
– The market may move quickly past your stop level.
– Liquidity might be thin.
– News may cause sudden repricing.
This is why the phrase “stop-loss” sometimes gets misunderstood. The stop-loss can limit how long you remain in a bad trade, but it cannot fully control the exact sell price in all conditions.
Take-Profit Orders: Securing Gains
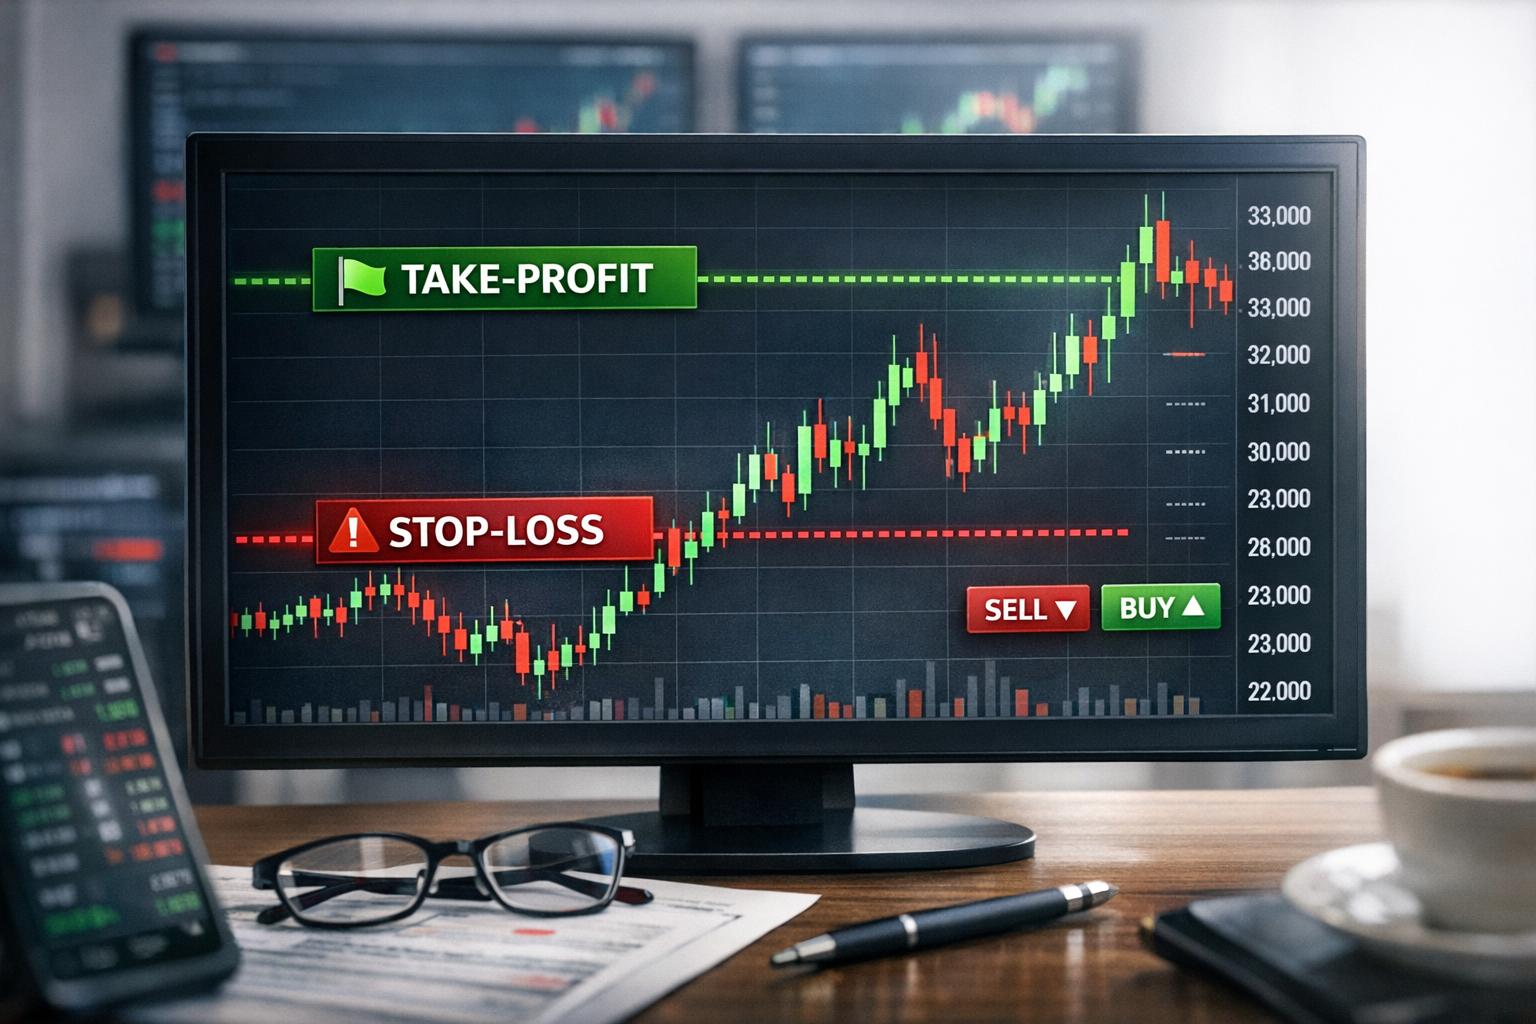
A take-profit order is the opposite side of the same coin. Instead of defining where you’ll exit to limit losses, you define where you’ll exit to lock in gains.
For high-volatility stocks, this matters because big moves often don’t travel in one direction. They surge, then they correct. If you’re waiting for “the perfect top,” you may turn a profitable trade into a regret diary.
A take-profit order tells your broker: “When the price reaches my target, sell automatically.” That removes the need to stare at performance like it’s going to change its mind because you looked at it long enough.
How a Take-Profit Order Works in Practice
Suppose you buy a stock at $100. You might set a take-profit at $120, planning to capture a 20% gain. If the stock price hits $120, your position sells automatically at (or near) that level, depending on the order type and market conditions.
The benefit isn’t only realizing profit. It’s also removing uncertainty. Once the price reaches your target, you don’t need to guess whether the market will keep going.
Advantages of Take-Profit Orders
Take-profit orders have several pragmatic advantages:
– They reduce time spent monitoring
If you can’t watch the market all day, a take-profit helps manage exits while you do, say, literally anything else.
– They support planned trade structure
When you enter with a stop-loss and take-profit, you’re effectively defining risk and reward ahead of time. That’s more systematic than improvising later.
– They prevent profit “leakage”
Some traders sell after a big run because they’re happy with the win. Others get greedy—or simply distracted—and give back gains during a reversal. A take-profit can help stop that.
– They help with emotional balance
You can’t be thrilled and terrified at the same time forever. Automating exits often makes it easier to view each trade as a process rather than a personal referendum.
Stop-Loss and Take-Profit Together: The Risk-Reward Relationship
Using stop-loss and take-profit together gives your trade a clear shape. You’re not just saying “I think it goes up” or “I think it goes down.” You’re also saying how much you’ll lose if you’re wrong and how much you want to gain if you’re right.
That’s the basic risk-reward structure many traders aim to balance. If your stop is too tight relative to your target, you may get stopped out frequently. If your target is too ambitious relative to your stop, you might win occasionally but lose more on the trades that go against you.
In practice, risk-reward isn’t one-size-fits-all. It depends on volatility, strategy, and time horizon.
A Simple Example of Combined Orders
Let’s continue the $100 example.
– Stop-loss at $95 (risk: $5 per share)
– Take-profit at $110 (reward: $10 per share)
This implies you’re risking $5 to potentially earn $10 if the trade moves your way. Whether that’s “good” depends on how often you expect your take-profit to hit versus your stop. High-volatility stocks might have wider ranges, meaning your stops and targets often need to reflect actual price behavior rather than your emotions.
Factors to Consider When Setting Orders
Setting these orders isn’t just picking numbers. It’s deciding what price movement would reasonably invalidate your thesis, and where you expect a meaningful positive outcome.
There are a few categories of factors that tend to matter most.
1) Risk Tolerance and Position Size
Risk tolerance differs from trader to trader. One person might accept a small loss repeatedly. Another might only trade when the stop is far less likely to get hit.
Your position size matters just as much as the stop level. A stop-loss defines the price trigger, but the number of shares determines how much money you actually lose.
For example, risking $50 on a stop-loss is very different from risking $500—even if the stop price is identical. In many cases, traders can manage risk more effectively by adjusting size rather than constantly tightening and loosening stop levels.
Also, a quick sanity check: if your stop-loss is so close that normal fluctuations will knock you out, you might be technically “risk-managing” while actually avoiding losing less. The stop becomes paperwork instead of protection.
2) Slippage and Execution Reality
You should be aware of potential slippage, which is the difference between the expected price of a trade and the actual price at which it’s executed. Slippage can occur during periods of high market volatility or low liquidity.
Slippage is especially relevant when you’re placing stop-loss orders in fast-moving stocks. Your stop may trigger when your order reaches the exchange, but the actual available price at that moment might already be lower than the stop price.
That doesn’t mean you should avoid stops. It means you should plan for them. If you’re trading a stock with wide spreads and frequent gaps, you may need to widen your stop level or reduce size to keep loss consistent with your risk plan.
3) Market Conditions and Stock-Specific Volatility
A stop-loss that works on a stable blue-chip may be too tight for a thinly traded growth stock. Likewise, a take-profit that feels reasonable in calm markets might never get hit before the trade reverses.
High-volatility stocks often require a more realistic assessment of how far price usually moves in the time you’re holding the position. This can come from:
– historical trading ranges
– average daily movement
– behavior around known catalysts (earnings, FDA decisions, major contract announcements, and so on)
If the stock routinely swings 10% intraday, setting a 2% stop-loss doesn’t match the environment you’re trading in. That’s just inviting a stop-out at the worst time, like locking your front door with a plastic spoon.
Market Analysis and Research
Even with automated orders, you still need a reason for entering. Stops and take-profits don’t create an edge; they manage the edge you already decided to pursue.
Fundamental Analysis: Knowing What Might Move the Stock
Fundamental analysis looks at the company’s financial condition and the drivers behind the business. For high-volatility stocks, specific news and earnings can change expectations quickly, which can then change the share price just as quickly.
If a stock’s valuation, revenue outlook, guidance, or balance sheet shifts, that’s the kind of information that can justify a trade and (in turn) affect where risk and profit targets make sense.
Fundamentals aren’t a guarantee, but they help you avoid trading blindly through known events. The more you understand the “why,” the easier it becomes to define “what would make me wrong.”
Technical Analysis: Timing and Levels
Technical analysis often helps with timing and with deciding where the market might react. Traders look at things like:
– moving averages
– support and resistance levels
– candlestick patterns
– volume trends
For stop-loss placement, traders frequently place stops beyond support levels or beyond a technical invalidation point. For take-profit placement, they often use previous highs, resistance zones, or measured moves.
The trick is not treating these tools as magic. They are best used as a way to reduce randomness. When combined with realistic volatility assumptions, technical levels can help you place orders where they have a better chance of functioning as intended.
Catalysts and Event Risk
High-volatility stocks often move most dramatically around events: earnings, guidance revisions, regulatory announcements, macro surprises, or even broader sector news.
Event risk should shape your order placement strategy. A stop-loss set without considering the likelihood of a gap can lead to surprise outcomes. If you’re trading around major announcements, it can make sense to plan for the possibility that your order might execute at a worse price than expected.
This isn’t about fear. It’s about expectations. You’re not trying to predict the price move; you’re trying to set orders that work with the reality of how the stock trades.
Ongoing Strategy Reevaluation
Trading isn’t a set-and-forget operation. Markets change. Your understanding improves. The stock you’re trading doesn’t politely stay within yesterday’s behavior.
If new information arrives, or if volatility shifts, you may need to reevaluate your order levels. Many traders do this after major price moves rather than constantly micromanaging.
Adjusting Stop-Loss Levels
One common approach is moving the stop-loss once the trade moves in your favor. This is often done to protect gains or reduce risk further.
For example, imagine you enter at $100 with a stop at $95. If the stock climbs to $110, you might raise the stop to reduce the likelihood that you give back everything. The goal is often to avoid turning a “winning trade” into an “almost-winning trade.”
However, you should be careful. Raising a stop too aggressively can kick you out on normal pullbacks, especially with volatile names. The stop should reflect the stock’s actual movement, not your mood.
Adjusting Take-Profit Levels
Take-profit levels also need reevaluation in some scenarios. If the stock breaks into new price territory and you believe the trend has more room, you might adjust your targets.
But do this with discipline. If you repeatedly move take-profit farther away because the price “looks like it wants to go higher,” you might be doing the exact thing take-profit orders were meant to prevent. It turns automation into a suggestion.
A better method is to decide your target rules in advance, such as:
– fixed target for the first exit
– partial profit-taking at one level, then a second target for the remainder
This approach keeps the plan intact while still allowing meaningful flexibility.
Tools and Resources for Learning
If you want to use stop-loss and take-profit orders more effectively, the best learning often comes from practice and repeated review. Many trading platforms provide order types, backtesting, and paper trading features that let you test ideas without risking real money.
You can also look for educational content from established finance sites. For further information, consider visiting sites like Investopedia or other educational finance websites.
Learning materials can explain the mechanics of different order types, such as how stop orders differ from limit orders, and how execution varies across broker platforms. That’s not trivia—it impacts results, sometimes more than you’d think.
Common Mistakes When Using Stop-Loss and Take-Profit Orders
To use these tools well, it helps to see the common ways traders accidentally sabotage them.
Mistake 1: Setting stops based on hope, not invalidation
A stop-loss should align with when your thesis breaks. If you place it where you “think it won’t go,” you may delay the inevitable. In volatile markets, the “won’t go there” level becomes the place it goes first.
A healthier approach is to decide what price movement would mean your trade is wrong. That’s your stop zone.
Mistake 2: Tight stops that match no realistic volatility
In high-volatility stocks, price noise is real. If normal fluctuations hit your stop constantly, you’ll get chopped up. You’ll spend more time re-entering than managing outcomes.
This mistake often shows up when traders pick stop distances arbitrarily (like 2% because it “feels safe”) rather than based on historical movement or technical structure.
Mistake 3: Ignoring spreads and liquidity
Thin liquidity can widen spreads, and wider spreads can affect both entries and exits. Even if your stop triggers, the executed price can be far from what you expect.
If you trade illiquid stocks, you should expect more variability in outcomes and consider whether the order placement should account for it through wider thresholds or smaller sizes.
Mistake 4: Moving take-profit repeatedly without a plan
Take-profit orders are designed to reduce emotion. If you constantly adjust them because the price is moving, you’ve reintroduced emotion into automated decisions.
If you want flexibility, use rules: partial exits, step targets, or predefined adjustments when certain conditions occur.
Mistake 5: Treating stops as the only risk control
A stop-loss can cap losses on a per-trade basis, but it doesn’t account for correlations across your portfolio. If you’re holding multiple positions in similar sectors or strategies, they may all fall at once.
Risk management works best when stops are just one part of a larger approach: diversify, size properly, and avoid concentration risk you can’t handle.
Real-World Use Cases
Sometimes the theory doesn’t click until you see a realistic scenario. Here are a few patterns that come up often.
Case: Trading an earnings-driven stock
Imagine you trade a stock that regularly jumps or drops 8–15% around earnings. Before the report, you set a stop-loss based on where your thesis fails—maybe below a key support level—or based on a volatility-adjusted distance.
You also set a take-profit at a level where the market may likely reassess, such as a prior resistance zone. After the earnings move, you let the order do its job. If the stock hits your target quickly, you lock in gains rather than trying to outsmart the post-earnings reversal.
Case: Swing trading with limited time
If you’re not glued to your screen, stops and take-profits matter more. You might enter based on technical signals, then place orders immediately. That way, when the market does something unexpected while you’re at work or sleeping, your plan already handles the exit.
Case: Long-term investors managing occasional entries
Long-term investors sometimes think stops are “for traders only.” That’s not strictly true. Some investors use stop-loss orders to define exit points for specific trades or for positions that represent higher risk than a typical long-term holding.
Take-profit orders might also be used selectively when an investor wants to realize gains at predetermined levels, especially in volatile names where upside can appear abruptly and then fade.
Conclusion
Stop-loss and take-profit orders are not complicated, and they’re not miracle devices. They’re structured exit tools that help you manage risk and secure gains in markets that can move faster than your rational plans.
When you understand how stop-loss orders limit the duration of a losing trade, and how take-profit orders prevent give-backs of profitable moves, you get something valuable: discipline. The market can still surprise you, but your response doesn’t have to be improvisation.
To use these orders well, set levels based on your risk tolerance, the stock’s actual volatility, and reasonable invalidation points. Be aware of slippage and execution realities, especially in volatile or low-liquidity situations. Then revisit your plan as new information arrives or price behavior changes.
In the end, the best order setup is the one you can follow consistently—on your best day and your worst one.