Understanding Intraday Volatility Patterns
Intraday volatility is the magnitude and pace of price movement inside a single trading day. It’s not just “markets being random” (though they sometimes act like it). Instead, the way volatility shows up across hours tends to repeat with enough consistency that experienced traders plan around it.
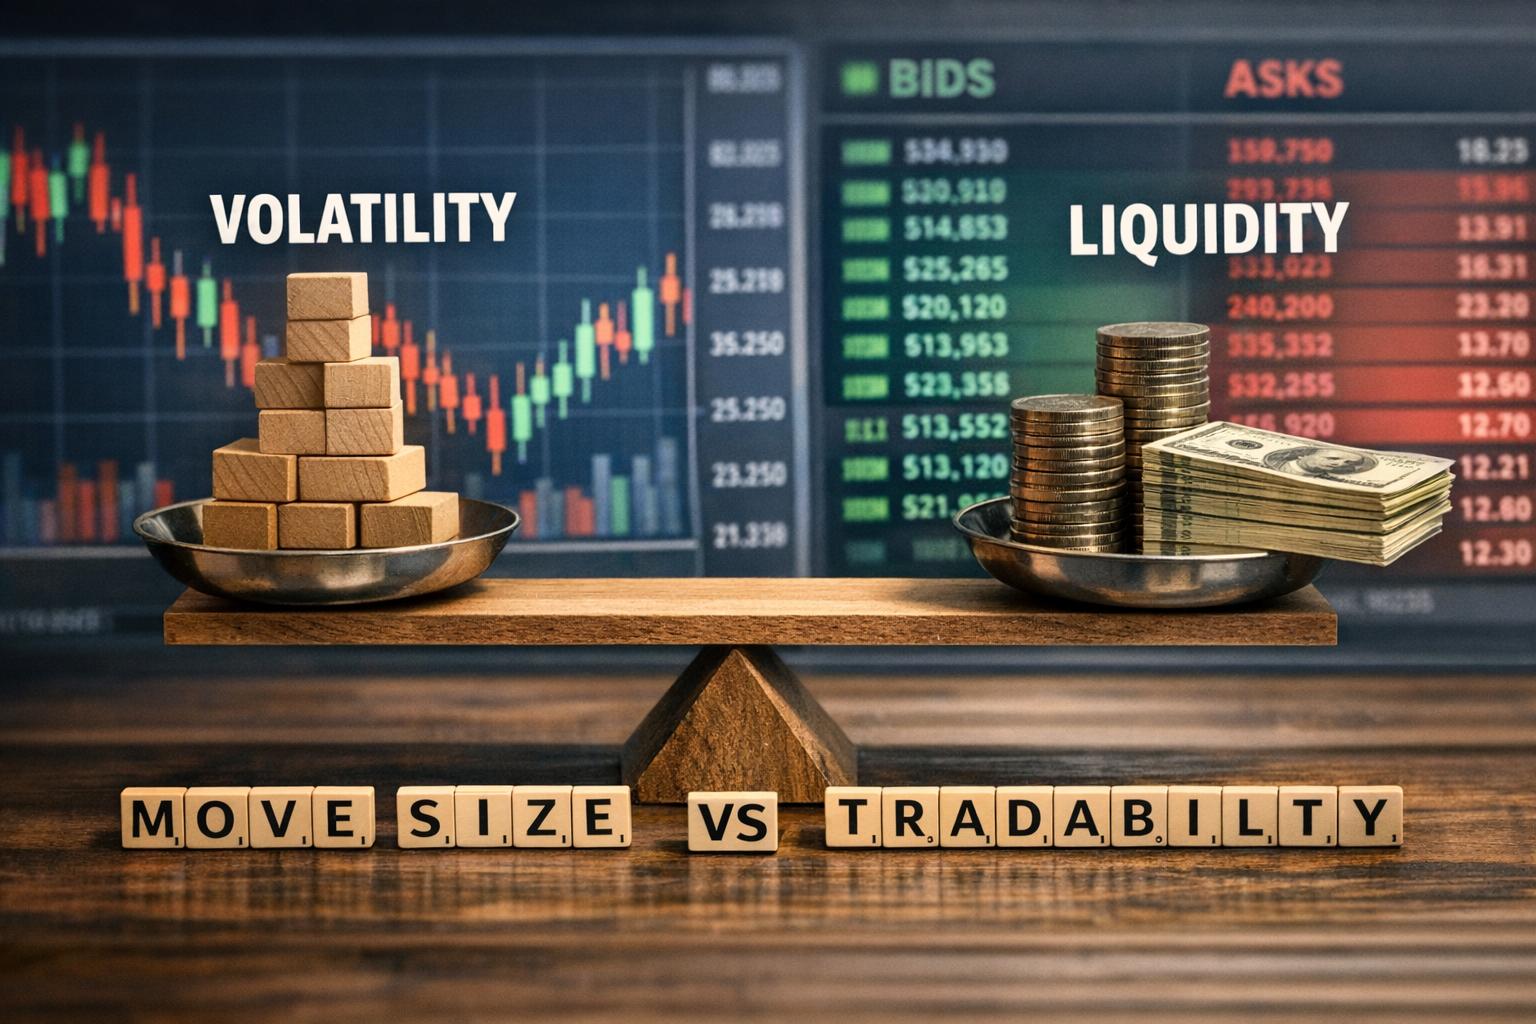
At a basic level, volatility measures how quickly prices change. In practice, intraday volatility matters because it affects transaction costs, execution quality, stop-loss placement, and the odds that a strategy behaves the way you think it will. If you’ve ever wondered why a setup that works great at the open falls apart at lunch—or why the close suddenly feels like the last episode of a show everyone binges—you’re already seeing the same mechanism.
Volatility itself reflects the rate at which prices change, and it’s influenced by order flow, liquidity, macroeconomic releases, institutional participation, and behavioral factors. Daily and longer-term volatility get a lot of attention, but intraday volatility is especially relevant for short-term traders, algorithmic systems, and execution desks that care about minimizing slippage and improving fills.
The typical intraday shape: why volatility isn’t evenly spread
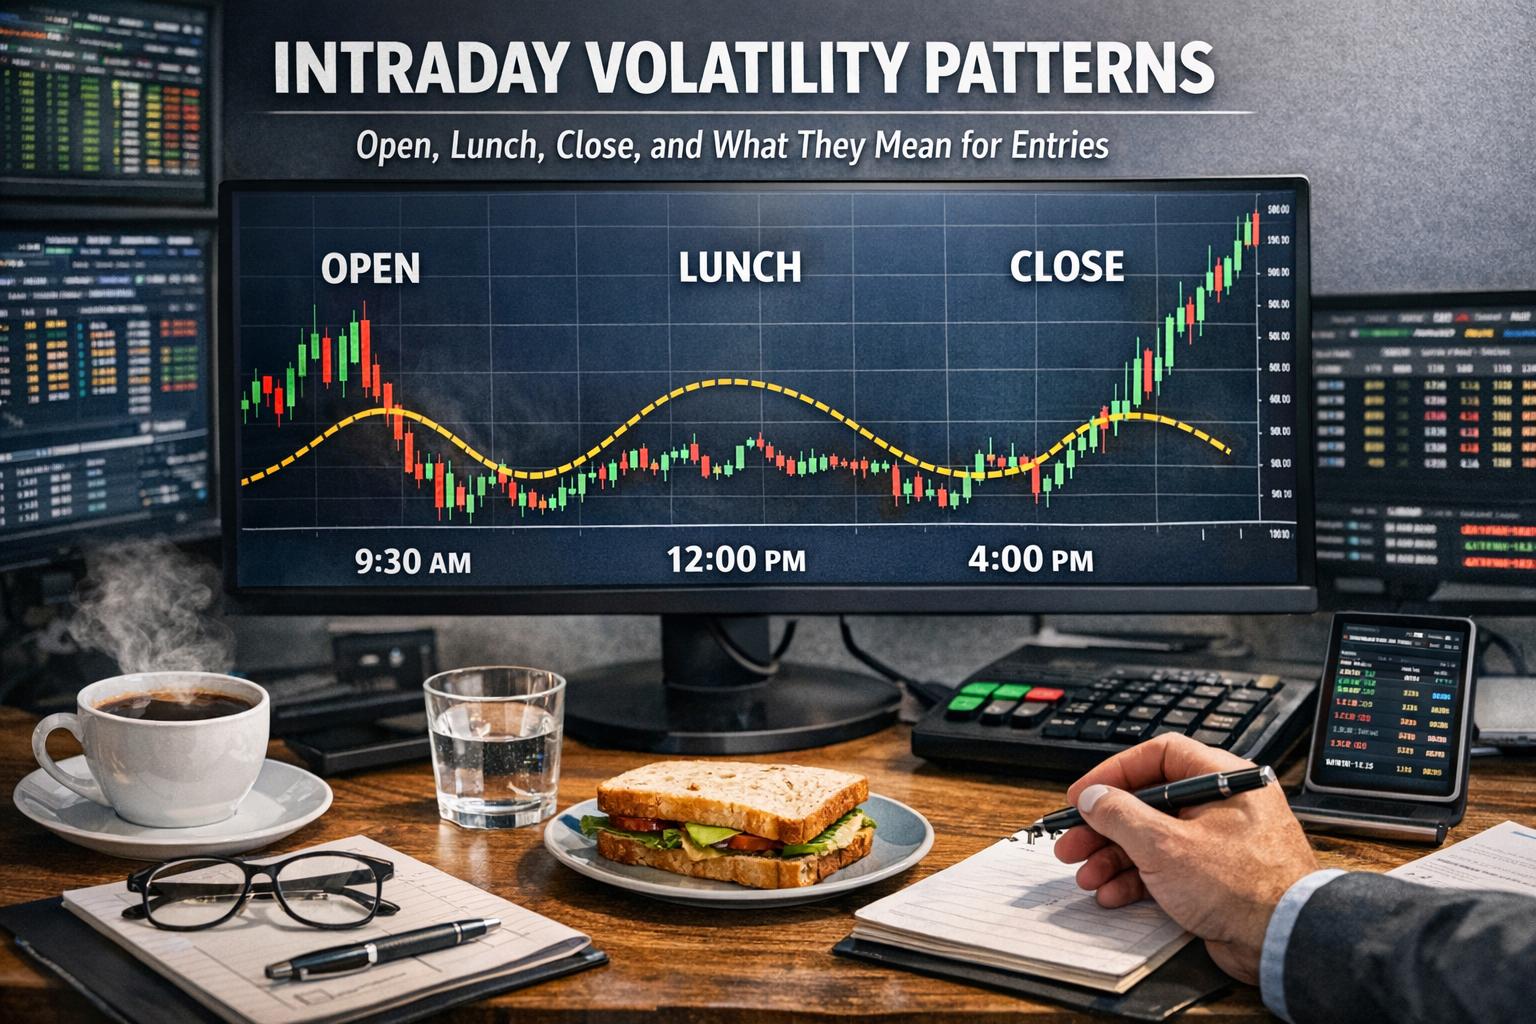
Many equity markets show a “U-shaped” volatility profile: higher volatility near the open, lower movement during midday, and a re-acceleration near the close. That pattern shows up often enough to build intuition, but it’s not a law of physics. Variations appear across asset classes, market regimes, and news schedules.
To make it useful, you need to understand what’s driving each part of the session:
- Liquidity (how easily you can trade without moving the price)
- Order flow (how much buy vs sell pressure hits the market)
- Information flow (what new data is arriving and when)
- Execution needs (when institutions must trade)
- Microstructure effects (bid-ask spreads, market depth, auctions)
When those ingredients change across the day, volatility changes with them.
The structure of the trading day (and why it matters)
Most liquid markets—even if they don’t all have exactly the same hours—can be mentally divided into three broad phases:
- Opening phase
- Midday phase
- Closing phase
Each phase tends to have a different mix of liquidity and order flow. That matters because the same percentage move can mean different trading conditions depending on time. For example, a 0.5% move on a thin midday tape typically results in worse execution than a similar move that happens during open auction conditions—at least for many retail participants and smaller desks.
Understanding how volume and volatility interact during these segments helps with practical decisions such as:
- Trade timing
- Position sizing
- Stop-loss placement
- Profit targets
- Order execution methods
Importantly, the dynamics of these phases aren’t only about charts. Human behavior shows up too. Institutions tend to cluster activity around known execution windows, while retail traders often become more active around the open or after headline-driven events.
The open: market opening volatility
The first portion of the trading day—especially the first hour—typically shows elevated volatility and higher volume. This is where the market absorbs the overnight information that built up while exchanges were closed. It’s the “read the news, now place the bets” portion of the day.
Common drivers include:
- Corporate earnings announcements
- Macroeconomic data releases
- Geopolitical developments
- Overseas market movements
- After-hours trading activity
Because overnight information continues to evolve while the exchange is shut, the open becomes the main time for price discovery. That price discovery process is quick and messy. It usually shows up as wider bid-ask spreads, sharp swings early on, and sometimes strong directional moves in certain names.
Price discovery and order imbalance
In many markets, the open involves an auction mechanism. Orders submitted before the official session open get aggregated, and the opening price forms based on the balance between buy and sell demand—plus market rules around execution.
When there’s meaningful order imbalance, you get opening gaps. A stock can open significantly above or below its prior close after major announcements, simply because the market reprices the asset before it can trade continuously.
In this situation, opening volatility often reflects:
- Rapid reassessment of fair value
- Concentrated “first prints” as the market starts trading
- Execution urgency from participants who missed prior trading hours
If you’ve ever placed an order right at the bell and watched the price move away before your fill—welcome to opening volatility. The open can reward speed and penalize impatience.
The opening range concept
Many traders use the opening range as an anchor. It typically refers to the high and low established in the first 5 to 30 minutes. The logic is straightforward: if enough participants agree on direction early, the range often becomes a battleground.
A break above the opening range high with convincing volume is often interpreted as upward momentum. A break below the range low can be interpreted as downside intent.
However, false breakouts are common. The open is where positioning changes hands quickly, and the market often “tests” levels before committing. So while traders use the concept as a reference, confirmation tends to matter more than the line itself.
In practice, traders often combine opening range logic with:
- Volume and trade counts
- Order book depth or liquidity measures
- Momentum indicators (but not blindly)
- VWAP or VWAP deviations to judge mean pressure
A breakout that happens on thin volume is more likely to fade than one where aggressive buying (or selling) overwhelms the opposing side.
Risk considerations at the open
Even if the open offers opportunities, it also brings hazards. The main risks are costs and execution quality.
- Wider spreads raise transaction costs, especially for limit orders that sit near the wrong side of the book.
- Rapid reversals increase slippage and stop-outs.
- Market orders can execute at unfavorable prices because price can move while your order is working.
- Volatility may decline fast after an initial spike, meaning early entries can turn into red positions if you misjudge timing.
This is one reason you’ll see two fairly different behavior patterns among traders:
- Some wait for stabilization, then enter with a calmer read on direction.
- Others trade the first burst itself, using tight risk controls and expecting fast movement.
Both can work. Just don’t mix their rules by accident. If you plan to scalp, don’t size like you’re investing. If you plan to invest, don’t treat the open like a casino roulette wheel.
Lunchtime: a midday lull
After the initial opening volatility cools off, markets often enter a lower-activity period—late morning into early afternoon in many equity sessions. This is the midday lull where the chart looks flatter, but “flatter” doesn’t always mean “safe.” It often means fewer participants are actively pushing price.
Typical features include:
- Lower trading volume
- Reduced price ranges
- Slower order flow
- Less follow-through when breakouts first appear
Several factors contribute to this pattern:
- Major economic data releases typically occur earlier in the day.
- Institutional desks may slow down temporarily while workflows shift.
- Retail participation can drop during work hours.
- Some algorithms shift toward passive liquidity provision rather than aggressive trade-taking.
As participation declines, liquidity can become thinner. Thin liquidity can compress movement when nothing happens… but when something does happen (a stop cascade, a headline, a large order), the move can happen quickly. So midday is often “quiet until it isn’t.”
Consolidation and range trading behavior
Midday markets frequently consolidate. Prices drift sideways inside support and resistance zones. Breakouts can occur, but follow-through may be weak because fewer buyers and sellers are actively willing to continue the move.
That makes midday conditions attractive for range traders. In this environment, mean and reversion behavior tends to show up more than trend persistence.
Range traders may:
- Buy near support levels
- Sell near resistance levels
- Use smaller profit targets
- Maintain tighter stop-loss levels
Trend-following strategies can struggle here if volatility drops sharply. A trend needs fuel—often provided by persistent order flow. Midday often provides less of it, which can cause trend systems to churn.
One practical note: “works in backtests” during midday can still fail in live trading if execution quality is poor. Liquidity matters. Even a great signal can underperform if fills are inconsistent.
Liquidity considerations during low participation
Reduced volume affects execution. A large order placed during this window may influence price more than expected relative to average market depth.
Institutional participants often avoid initiating substantial positions during low-liquidity periods unless there’s a strategic reason—such as portfolio rebalancing, mandated trades, or scheduled hedging.
Meanwhile, many algorithmic strategies reduce participation rates midday to reduce market impact. They might still trade, but they behave more like a gentle breeze than a bulldozer.
To a trader, this shows up in:
- Wider micro bid-ask spreads relative to the day’s midday averages
- More frequent “stalling” near levels
- Lower volatility but sometimes sudden spikes around specific events
So midday can be good for patience and poor for forcing trades.
The close: increased activity near market close
Volatility often rises again in the final hour of trading. This closing period tends to involve adjustments and “finish work” activity. Traders often want to set exposure before the session ends, especially for assets where closing prices matter for benchmark calculations.
Closing volatility is influenced by:
- Portfolio rebalancing
- Index fund adjustments
- Options hedging activity
- Intraday trader position unwinding
- Execution of market-on-close orders
Many markets use a closing auction similar in concept to the opening auction. Orders accumulate, then execute at or around the close price. When large order flow arrives near the end, price can shift quickly and momentum can briefly dominate.
Institutional participation and benchmark mechanics
Institutions often prefer executing near the close to reduce tracking error versus benchmark indices. Benchmarks can be calculated using closing prices, which makes the close a practical anchor point for many portfolio managers.
When institutional participation increases, trading volume often rises. It can also bring sharp price changes—particularly if program trading, index reconstitution, or hedging pressure hits at the same time.
If you observe rising order flow, volume acceleration, or a momentum shift late in the day, it’s usually wise to:
- Tighten risk controls
- Be cautious about assuming the midday regime will persist
- Consider whether your intended hold time extends beyond the close
Late-day trading can feel like the market is “locking in.” That’s because it is, in a way.
End-of-day strategies: what traders actually do
Traders often develop tactics specifically for the last part of the session. Common approaches include:
- Trend continuation trades when the day’s direction remains intact.
- Mean reversion trades when price deviates significantly from intraday averages.
- Overnight positioning when traders expect continuation into the next session.
Overnight positioning adds another layer: after-hours news can hit, and gaps can form at the next open. So decisions made near the close often include explicit assessments of overnight risk, such as upcoming economic releases or earnings.
Practical example: suppose a stock rallies strongly into the last 30 minutes after a favorable macro report. A trend continuation trader might hold for a planned overnight move. But a mean reversion trader might expect buyers to fade once the “need to buy now” pressure (index-related, hedging, or end-of-day forced execution) passes.
Both can be rational. The difference is the model each trader uses for order flow and price behavior—and how well it matches what’s actually happening.
The U-shaped volatility curve (and why it keeps showing up)
If you plot intraday volatility across time, it often forms a U-shape: high at the open, lower around midday, and higher again near the close. This pattern has been observed across decades in equity markets and appears consistently enough that it’s become part of standard market intuition.
Empirical research supports the idea that intraday trading activity and liquidity distribution help produce persistent volatility structure. But there are plenty of exceptions.
- Central bank announcements can elevate midday volatility.
- Earnings releases during trading hours can disrupt the normal intraday pattern.
- Geopolitical developments can create sustained volatility across multiple periods, not just the open and close.
- Market regime changes (risk-off periods, high headline sensitivity) can increase baseline intraday volatility.
So yes: the U-shape is useful. But the market has a habit of changing its mind when new information arrives. Real-time context still matters.
Role of algorithmic trading and high-frequency trading
Modern markets run on algorithms, and that includes strategies that directly influence liquidity and price movement. These systems react to order imbalances, spreads, and statistical signals within milliseconds (and for many assets, that’s plenty fast to matter).
Algorithmic trading can both dampen and amplify intraday volatility:
- Market-making algorithms may stabilize prices by supplying liquidity and narrowing spreads.
- Momentum algorithms may accelerate directional moves when signals confirm or when order flow trends.
- Statistical arbitrage systems may compress spreads across correlated assets, reducing volatility in relative terms but sometimes increasing volatility during brief dislocations.
The concentration of algorithmic participation around opening and closing auctions can intensify those intervals. Algorithms often treat those auctions as predictable high-activity environments—so their collective behavior can create bursts of volatility.
That’s also why you can’t judge volatility only from your chart’s candle size. Microstructure effects matter. A period that looks calm visually might still involve fleeting liquidity gaps that affect execution quality.
Implications for trade entries (time-of-day isn’t cosmetic)
If intraday volatility changes across the day, then entry timing affects probability distribution of outcomes. A “good” signal might still underperform if you enter at a time when the market’s variance and liquidity conditions are fundamentally different.
During the open: what to expect
Traders active early should prepare for quick movement and fast regime shifts.
- Assume rapid price movement and plan for it.
- Use predefined stop-loss levels rather than improvising mid-chaos.
- Account for slippage and spread impact.
- Evaluate pre-market data and news, not just the first candle.
Breakout and momentum strategies often appear during this window. Still, position sizing tends to need more attention because the volatility distribution at the open differs from midday.
A common mistake: entering with the same size as midday because the setup “looks the same.” It might not be. The candle is not the strategy; the market conditions are.
During midday: trade selection matters more
During the lunch lull, traders often need to adjust how they think about signals. Lower volatility can reduce range opportunities, but it can also make mean reversion more workable.
- Scale back position size to reflect thinner liquidity.
- Favor mean-reversion setups if the market consolidates.
- Use technical analysis for structure, not for prophecy.
- Avoid initiating trades without clear volume confirmation.
Midday execution can also be trickier because fewer active traders can mean your order interacts with the market differently than it would in higher-volume windows.
So if you’re trading midday, consider whether your expected edge depends on continuous order flow or whether it survives intermittent liquidity.
Near the close: watch for auction effects
As the close approaches, you’ll often see volume acceleration and short-term trend behavior. That doesn’t mean every stock trends. It means the market shifts toward execution-driven flow.
- Monitor volume acceleration and order flow changes.
- Adjust trades to align with intraday direction.
- Reduce exposure if you want less overnight risk.
- Anticipate volatility spikes linked to auction mechanisms.
Effective trade management near the close frequently depends on order types and auction mechanics such as market-on-close or limit-on-close orders. Using the wrong order strategy at the wrong time can make “right idea, wrong execution” happen in real life.
Risk management across intraday phases
Risk management isn’t only about your stop-loss price. Intraday volatility affects leverage, risk-reward ratios, and how often stops get hit by noise.
The practical move is to treat time-of-day as part of risk modeling.
Key considerations include:
- Adjusting stops to reflect time-of-day volatility averages.
- Avoiding overtrading during low-volatility intervals that don’t offer enough reward for churn.
- Reducing leverage during high-volatility announcements to avoid blowups from short-term spikes.
- Monitoring cumulative daily risk exposure rather than thinking each trade is isolated.
Some traders use average true range (ATR) calculated over intraday time frames to adjust expectations. ATR isn’t magic, but it’s a pragmatic way to translate volatility into more realistic stop distances and target ranges.
A simple mental model helps: if ATR is higher near the open, then the market naturally produces wider “normal” swings. Your stops can’t assume midday behavior while trading open conditions.
Application across asset classes
The U-shaped pattern shows up most clearly in equity markets, especially those with auction mechanisms. Still, the idea that volatility clusters by time holds across other asset classes too—but with different drivers.
Futures markets
Futures can show strong reactions to economic releases and can trade more continuously than many equity sessions. That means volatility spikes can occur around events that may not align neatly with equity open or midday.
You might see volatility rise around:
- Scheduled macroeconomic announcements
- Major commodity supply updates
- Geopolitical risk headlines affecting risk sentiment
Even when midday looks calm, futures can remain jumpy if news timing hits during those hours.
Foreign exchange (FX)
FX markets operate continuously throughout weekdays. Intraday volatility typically clusters around regional session overlaps. For many participants, the London–New York overlap often brings elevated activity because liquidity and participant overlap increase.
So instead of “open and close” in the equity sense, FX traders think in terms of:
- Tokyo session activity
- London session liquidity
- New York overlap and closing adjustments
This matters because a strategy designed for a quiet time in equities might land right in the middle of an FX overlap window.
Cryptocurrency markets
Cryptocurrency markets trade 24/7 and lack a centralized closing auction comparable to equities. So the traditional U-shape won’t map perfectly.
Still, liquidity and volatility can increase during times aligned with major financial centers. When Bitcoin and major alts experience liquidity shifts, it often mirrors broader participant activity. So while the mechanism differs, time-based volatility clustering can still show up.
Also, crypto has its own behavior quirks: leverage, liquidations, and reflexive order book effects can create sharp volatility spikes that aren’t always “orderly” in the way many equity sessions are.
Data analysis and measurement of intraday volatility
To work with intraday volatility patterns, you need measurement tools and a method for validating whether a pattern holds for your specific market, timeframe, and strategy.
Common analytical approaches include:
- Standard deviation of returns over intraday intervals
- Volatility heat maps
- Volume-weighted average price (VWAP) deviation analysis
- Intraday range statistics (high-low ranges by time bucket)
- Order flow imbalance metrics
A frequent workflow looks like this:
- Segment the trading day into time buckets (for example, 5-minute or 15-minute intervals).
- Compute volatility metrics per bucket for historical data.
- Average the results across multiple days to estimate typical behavior.
- Compare the averages to the current regime and event schedule.
- Test whether your strategy edge still holds after spreads, slippage, and real execution constraints.
This approach makes the volatility pattern practical. It turns “seasonal” intraday intuition into a quantifiable assumption you can stress-test.
One caution: intraday data quality matters. If your data feed handles late prints differently or your historical candles don’t reflect the same market microstructure, your measurements can drift. That’s the kind of bug that politely wastes months of your life.
Putting it all together: practical ways traders use intraday volatility patterns
Many traders don’t “trade the model.” They use volatility patterns to make better decisions about execution and risk.
Here are a few realistic examples of how this looks in day-to-day trading:
Example 1: Stop placement depends on where you entered
If you place stops without considering the time-of-day volatility regime, you’ll often see stop-outs cluster at particular times. For example, a stop distance that fits midday noise might be tight during open conditions. Adjusting stop distance using intraday volatility averages can reduce random churn.
Example 2: A midday mean reversion setup might be a lunchtime trap
Midday can favor range trading, but only when liquidity behaves as expected. If a midday period overlaps with an unexpected news catalyst, volatility may not compress as usual. A trader following “midday always ranges” thinking can end up trading against a new regime.
Example 3: Close strategies need auction-aware execution
Closing volatility often comes from execution-driven order flow. Traders who ignore auction mechanics might find their orders don’t fill where they expected. Using the right order type and considering market-on-close behavior can matter more than the indicator signal.
Conclusion
Intraday volatility patterns give you a structurally informed way to understand how markets behave across the trading day. Higher activity around the open reflects price discovery and rapid incorporation of new information. Reduced movement in the midday hours often aligns with lower liquidity and more consolidation behavior. Volatility tends to pick up again near the close due to institutional participation, portfolio adjustments, options hedging, and auction-driven execution mechanics.
Recognizing these recurring dynamics helps traders refine entry timing, adjust stop placement, and align strategy behavior with the market conditions that actually exist at each hour. That said, intraday patterns aren’t immune to regime shifts. Central bank announcements, earnings surprises, and geopolitical shocks can change the usual profile quickly.
So the goal isn’t to memorize the U-shape and call it a day. It’s to treat time-of-day volatility as a real input—then keep your eyes open when the market decides to do something else. Continuous analysis and disciplined execution remain the boring, effective part of trading. And yes, boring is sometimes the best flavor.