
Introduction to the VIX Index
The VIX Index has earned its nickname for a reason. Market participants often call it the “fear gauge” or “fear index,” because it gives a quick, numbers-first view of how anxious investors seem to be about future volatility. That makes it popular with retail traders, professionals, journalists, and anyone who’s ever watched a “calm” market suddenly decide it’s done with calm.
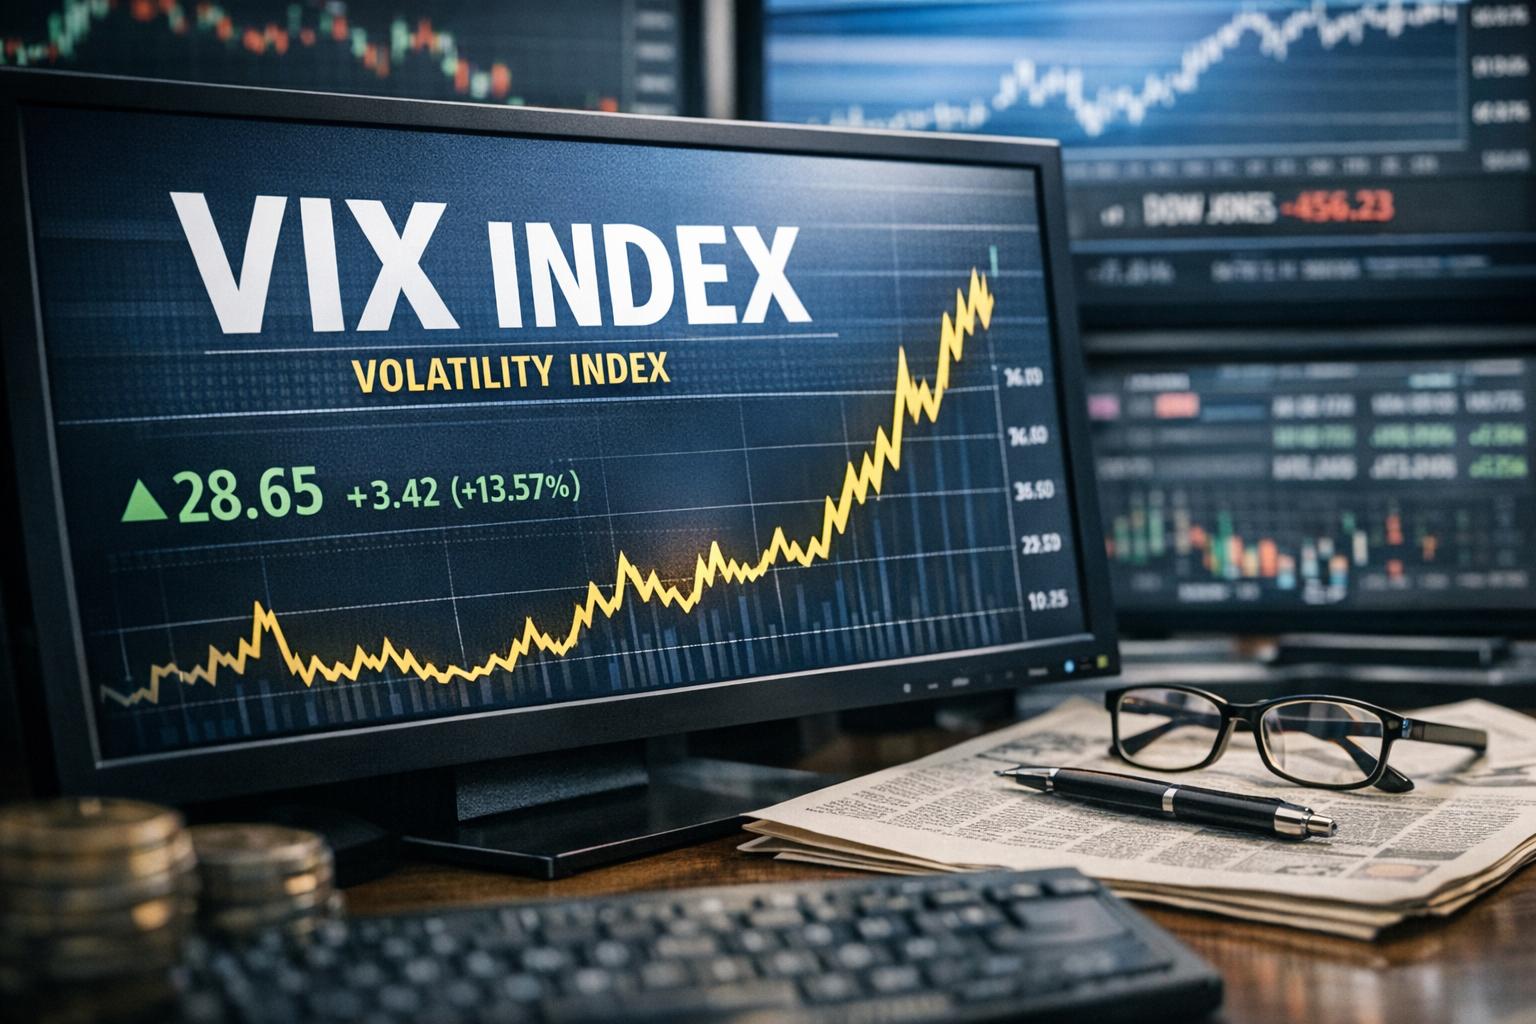
At its core, the VIX reflects the stock market’s expectations for volatility over the next 30 days, derived from option prices tied to the S&P 500 index. You can think of it as a real-time snapshot built from how traders price risk using S&P 500 index options. When option buyers (especially put option demand) get more worried, volatility expectations tend to rise—and, correspondingly, so does the VIX.
It’s also worth saying something practical up front: the VIX is not there to tell you whether the market will be up or down next week. It’s there to tell you what volatility the market is pricing in. In other words, it measures the market’s expectation of variation in returns, not the market’s opinion on the direction of returns. Traders can hate this distinction, but it matters. (It matters more than people want it to, because markets love to ignore our comfort zones.)
Understanding Market Volatility
Volatility is how much the price of a financial instrument tends to vary over time. In practical terms, it tells you the likely “range” of movement around average behavior. High volatility typically means the market is moving more aggressively—fast swings up, fast swings down. Low volatility usually means price action is steadier, at least according to how traders are pricing the future.
That’s why the VIX matters. It doesn’t measure uncertainty in a philosophical sense. It measures uncertainty as inferred from option prices—basically, what traders think volatility will be. And because volatility often rises when investors expect stress (earnings surprises, economic releases, geopolitical headlines, rate shocks, you name it), the VIX quickly becomes a proxy for sentiment.
There’s also a second-order effect that people sometimes miss: when volatility expectations rise, the market often reprices many risk assets at once. That’s not because every participant suddenly becomes psychic. It happens because risk models, portfolio constraints, and hedging costs all react to volatility assumptions. If volatility expectations increase, the cost of hedging increases; if the cost increases, risk appetite frequently drops. The VIX sits right in the middle of that feedback loop.
How the VIX Works
While the VIX gets talked about in simple terms, the construction is anything but simple. The index is calculated using a range of S&P 500 options. Specifically, the VIX methodology extracts implied volatility from out-of-the-money option prices across multiple strike prices. It uses both put and call options, then applies a weighting structure that turns those option prices into a single index figure.
These options tend to be highly liquid, which is one reason the VIX became the default “volatility barometer” for the U.S. equity market. High liquidity generally makes the implied volatility signal less noisy than it would be if you tried to compute a volatility expectation from thinly traded options.
If you’ve ever wondered why people react to the VIX at market open like it’s the weather forecast—this is why. The index is updated continuously during market hours, which makes it useful for real-time risk monitoring.
One more practical detail: implied volatility is forward-looking because it’s backed out from current option prices. Options traders are willing to pay premiums based on probabilities they assign to future volatility. That willingness shows up directly in the option chain, and the VIX effectively reads that chain like a report card.
The Importance of the VIX Index
The VIX provides a single, widely recognized number that many participants treat as an estimate of expected volatility. That matters because markets rarely move in perfectly linear ways. Even without a full options book, the VIX gives a quick sense of whether investors are pricing a “rougher ride” ahead.
In broad strokes:
- Higher VIX generally signals expectations of larger price swings (often linked to market stress).
- Lower VIX generally signals expectations of smaller price swings (often linked to calmer market conditions).
The practical value shows up around major news. For example, before or during events that can move equities—central bank statements, big CPI prints, unexpected geopolitical developments—the VIX often shifts quickly. Investors treat it as a warning light or, depending on their temperament, a signal to wait or to act.
If you’ve spent any time around a trading desk during a headline day, you probably heard the same conversation in different words: “Vol’s changing.” The VIX is one of the fastest, most standardized ways to communicate that change. It’s not the only measure, but it’s often the first one people mention because it’s easy to reference.
Using the VIX for Investment Decisions
People use the VIX in different ways, and it’s worth separating “watching” from “trading.” Most investors aren’t constantly buying VIX futures. They’re trying to decide how aggressive to be with risk.
Here are a few common patterns:
- Risk reduction: If the VIX rises and stays elevated, some investors reduce exposure to long equity positions or shift to lower-volatility strategies.
- Hedging: Fund managers may buy protection (or structure options positions) when implied volatility looks expensive or cheap relative to expectations.
- Contrarian thinking: Some traders interpret very high VIX readings as signs that fear is already “priced in,” potentially offering better risk-reward entry points—though this requires discipline because fear can last longer than anyone’s patience.
It’s also common to see VIX referenced in daily market commentary, especially during drawdowns. If you’ve ever read “the VIX jumped” during a selloff, you already get the gist: traders became more willing to pay for protection, which often lifts the volatility forecast embedded in options.
In real portfolio work, the VIX often shows up alongside other controls, too. For example, a fund might limit exposure when volatility rises above a threshold, or it might tighten stop-loss behavior during higher-vol regimes. Even if the VIX isn’t the deciding factor, it frequently acts as a shorthand for “conditions changed, treat risk differently.”
Limitations of the VIX
The VIX is useful, but it’s not a magic crystal ball. Two limitations show up again and again:
- It reflects expectations, not a guarantee: A high VIX doesn’t mean the market will immediately drop. It means traders expect higher volatility over the next month.
- It’s context-dependent: The same VIX level can mean different things depending on trend, macro regime, and liquidity conditions. Without context, it’s easy to overreact.
Using the VIX alone can lead to rushed decisions. A safer approach is to pair the VIX with price action, broader market indicators, and—if you trade options—an understanding of how implied volatility interacts with strike selection and time-to-expiration.
Also, remember that people interpret the VIX through their own experiences. A retail investor might see VIX 22 and think “not too crazy.” A systematic trader might see it as a regime change if it broke from a long stretch below 14. The number is the same; the meaning isn’t.
History and Development of the VIX Index
The VIX didn’t appear because someone woke up and said, “Let’s invent fear as a number.” It emerged from a practical need: market participants wanted a standardized, transparent metric for expected volatility based on option markets.
In 1993, the Chicago Board Options Exchange (CBOE) introduced the VIX. At the time, the goal was straightforward—offer a measure of expected volatility using S&P 500 options. Over the years, the index has been refined so it better represents the volatility implied by options across a fuller set of strike prices and expiration terms.
Even though markets evolve, the underlying idea remains consistent: options embed expectations about volatility, and the VIX converts that embedded information into a way that anyone can compare over time.
If you zoom out, that “comparability over time” is the real reason the VIX stuck. Before standardized indices like this, implied volatility could be estimated, but it was harder to compare across days and participants. The VIX created a shared reference point. People still disagree about how the future will go, but at least they can agree on the volatility expectation input they’re talking about.
Calculation and Methodology
Modern VIX construction uses a consistent approach: it extracts implied volatility from a strip of S&P 500 options across multiple strike prices. The index methodology then converts those implied volatilities into a volatility estimate that corresponds to a theoretical 30-day horizon.
Rather than relying on just a few option strikes, the broader strike selection reduces distortions. In early versions, fewer strikes and a simpler approach limited how completely the index captured market-implied volatility. The current framework generally uses a wider strike set so the index reflects a more comprehensive view of option demand across different price levels.
Under the hood, the process involves:
- Sampling option prices across strikes (both calls and puts, with rules to ensure consistency)
- Computing implied volatility inputs from those prices
- Weighting the contributions across strikes
- Converting the results into the final index value expressed in volatility terms
For readers, you don’t need to reproduce the formulas in a notebook. But you should know the index is not a random “market mood meter.” It’s engineered from option pricing mechanics.
One helpful way to think about methodology is that it’s designed to approximate a specific time horizon and to dampen distortions from any single strike or expiration. Traders may still debate the “perfect” representation of volatility, but the VIX is broadly accepted because it’s consistent and transparent in how it maps option prices into an index number.
Why Investors Pay Attention to the VIX
People watch the VIX because it’s available, standardized, and recognized across the market. Trader psychology does not travel with paperwork, but volatility expectations do. When risk rises, the cost of protection changes first in implied vol—then you see the effect in spot market behavior.
The VIX also helps risk management. Even if you’re not trading options, the index gives a sense of whether “normal” is still applicable. A portfolio that’s comfortable in a low-vol regime might behave very differently once volatility expectations increase.
It’s also a timing tool. During a typical trading day, the VIX can tell you whether volatility is being repriced quickly or slowly. That matters if you manage intraday risk, if you trade options with short time to expiration, or if you’re managing leverage based on volatility forecasts.
The VIX in Context of Strategic Portfolios
Professional portfolio managers don’t treat VIX as the only variable, but it often shows up in risk frameworks, including:
- position sizing rules (how much risk to hold at different volatility expectations)
- stress testing assumptions (what drawdowns might look like)
- hedging triggers (when to buy protection)
It’s also common for trading systems to incorporate volatility indices as features. For example, a strategy might reduce leverage when VIX climbs above a threshold, or it might widen intraday bands when volatility increases.
That’s the practical value: VIX gives you a quantifiable “knob” for volatility-regime awareness. Without something like that, managers would have to estimate implied volatility themselves, one option chain at a time, which is… a lot.
In hedge fund and institutional settings, “a lot” turns out to be expensive. The VIX saves time and simplifies communication across teams. When everyone uses the same reference metric, you reduce the chance that different models generate different interpretations of “volatility is up.”
Interpreting VIX Levels
There are no universally perfect cutoffs—markets don’t read textbooks—but certain ranges get used frequently in commentary.
- Below 20: often associated with relatively stable conditions, where investors expect less movement.
- 20 to 30: typically indicates moderate uncertainty. Markets may still be tradable, but price action can be less forgiving.
- Above 30: commonly signals heightened uncertainty and a greater probability of sharper swings.
What matters is how VIX behaves relative to its recent history. A VIX move from 12 to 18 might feel dramatic to a trader accustomed to stability, even if it’s still “low” in absolute terms. Likewise, a VIX reading of 28 might look tame if it’s below recent extremes—or alarming if it’s rising quickly from 18.
Also, try not to treat VIX levels as “risk on/off” switches. A VIX of 27 might still mean less risk than a prior period of 35—or it might mean something totally different if it’s coming off an unusually low-vol stretch. Volatility isn’t just a level; it’s a change relative to what the market is used to.
Applications Beyond Traditional Equity Markets
Because the VIX is built from S&P 500 index options, it originates in U.S. equities. Still, it has grown into a broader risk reference. Traders in other asset classes often monitor the VIX because equity volatility spills over into other markets—directly through portfolio exposure and indirectly through risk sentiment.
In times of stress, you’ll notice correlations tighten, and “risk-off” behavior can dominate. The VIX often becomes part of the language used across desks, not because it describes everything, but because it describes something central: the cost of volatility expectations in equities.
For example, if implied volatility rises in the equity index, you often see changes in how investors value risk across credit and rates. That doesn’t mean every relationship will line up neatly, but it does mean the VIX can function as an early indicator of broader risk repricing.
Over time, derivatives based on the VIX also expanded the use cases. Instead of only watching implied volatility in the underlying equity options, traders can take positions tied to the VIX itself.
VIX Derivatives: Leveraging Volatility
Once the market realized investors wanted ways to hedge and speculate on volatility expectations, VIX derivatives moved from niche to mainstream. These include VIX futures, VIX options, and exchange-traded products (ETPs) linked to VIX exposure.
There are a few ways this shows up in real trading:
- Hedging: If you have an equity portfolio that’s sensitive to volatility spikes, VIX-linked products may offer a way to add protection.
- Speculation: Traders may attempt to profit from changes in expected volatility by taking positions based on future VIX levels.
- Volatility trading: Some strategies focus directly on implied volatility dynamics and term structure, rather than direction of the S&P 500 itself.
If that sounds like “trading volatility,” it is. But it’s also trading something more specific: how the market prices volatility over time, including expectations about how volatility might evolve.
A small real-world story: a colleague once described options trading as “watching a ceiling fan.” You’re not controlling which room you’re in, but you can control trade-offs: the fan speed (volatility expectations), the time window (expiration), and the cost (option premium). VIX derivatives are similar. You’re mostly controlling exposure to the volatility forecast, not the “room temperature” of the economy.
Challenges Associated with VIX Derivatives
VIX derivatives aren’t “set it and forget it” instruments. The biggest challenges usually relate to pricing mechanics, product design, and the fact that volatility behaves differently from stock prices.
Some common issues traders run into:
- Sensitivity to futures curves: VIX futures reflect expected volatility across different maturities, not just one point in time. A futures curve shape (contango or backwardation) can influence returns.
- Holding period effects: Many ETPs aim to track volatility exposure over short horizons. If you hold longer than the product’s design expects, tracking can deviate.
- Liquidity and spreads: Even though VIX-related products can be actively traded, liquidity can vary by contract month and by product type.
- Complexity for non-options traders: Some people treat VIX derivatives like equity trades. That’s when they get surprised. Volatility products require a different mental model.
Think of it like this: if you buy a storm umbrella, you want it to work during the storm, not just during the forecast. With VIX derivatives, “the storm” can be noisy, and the timing matters.
Another nuance: volatility products can show negative expected performance over some environments, especially if the structure tends to decay. That’s not a moral failure of the product. It’s a mathematical consequence of how futures and implied volatility interact. If you don’t account for that, you can lose money while being “right” about the general idea that fear exists, simply because the timing didn’t cooperate.
Future Implications of the VIX
The VIX is likely to remain central because implied volatility derived from options will always be one of the most direct ways to infer risk expectations. As markets evolve—higher participation in options, more automated trading, and more events that move prices—the signals embedded in option prices will still be worth watching.
It also serves as a behavioral indicator. The VIX reflects how investors and institutions price fear, and fear rarely behaves politely. When volatility expectations rise and stay elevated, it often changes how markets price risk across the board.
At the same time, market structure keeps changing. New volatility products, evolving hedging practices, and ongoing updates to index methodologies mean you shouldn’t treat VIX as static. It’s stable as an instrument, but the market around it moves.
Over time, you may see more volatility indices and more ways to measure stress across asset classes. Still, for equities tied to S&P 500 options, the VIX remains the standard reference point because of its history, liquidity, and broad adoption.
How to Use the VIX Without Making It Your Whole Personality
You don’t need to obsess over the VIX every minute to make it useful. For most investors, it’s best treated as context.
Here’s a practical way to use it:
- Watch whether the VIX is rising, falling, or flat relative to recent history.
- Compare VIX movements with major market moves (including whether price and volatility are moving together).
- If you trade options, think about whether volatility is cheap or expensive relative to your expected distribution of returns.
As a real-world example, consider a portfolio manager deciding whether to maintain equity exposure into an event week. If the VIX is rising and implied volatility for near-term expirations is bid aggressively, the manager might reduce risk or buy protection. If the VIX is flat and markets are stabilizing, the manager might hold steady. It’s not a guarantee, but it’s a coherent process.
In practice, the VIX works best when you already have a risk framework. Without a framework, you can stare at the number and create meaning where none exists. With a framework, you can treat the VIX as one input among many, which is what most professionals do, even if they talk about it like it’s a solo act.
Common Misinterpretations
The VIX attracts attention partly because people project narratives onto it. Sometimes that helps—meaning it clarifies what’s being priced. Other times, it confuses.
Common misunderstandings include:
- “High VIX means the market will crash immediately.” Not necessarily. High VIX means expected volatility is elevated; price could chop sideways or rally with big swings.
- “Low VIX means stocks are safe.” Low volatility can coexist with declines, especially if the decline happens without volatility expanding at first—or if volatility is being mispriced for a given time horizon.
- “The VIX predicts direction.” The VIX is about volatility expectations, not a direction forecast.
If you keep returning to that core distinction—volatility expectation versus price direction—you’ll avoid a lot of avoidable mistakes.
One of the more common mistakes is treating VIX changes as an index of “news intensity” rather than implied volatility. News matters, sure, but the VIX is what traders are willing to pay for future volatility. That willingness depends on supply and demand for options protection, hedging needs, and how traders expect future events to shape realized volatility.
VIX in Practice: Scenario Thinking
It helps to imagine a few scenarios rather than treating the VIX like a standalone headline. Here are three simplified scenarios that show why investors care and why they also get into trouble.
Scenario 1: Calm market slowly gets noisy
Suppose equities trade higher for weeks with a VIX around the mid-teens. Then, after a major macro event, the VIX starts climbing. It may not surge to 30 right away, but upward drift in VIX suggests rising volatility expectations. Investors who ignore that drift might face larger drawdowns than their risk model assumed. Those who pay attention might reduce exposure or adjust hedges.
This scenario is common because markets often move from “price trending smoothly” to “price moving around more” without an immediate collapse. The VIX can show that shift in the background. If you manage risk with a stable-vol assumption, the drift matters. It also matters for option strategy selection because a slowly rising VIX usually means option premiums start to firm up even if the stock index keeps grinding upward.
Scenario 2: VIX spikes during stress, but markets don’t behave as expected
In a selloff, the VIX can jump quickly. The instinct is to assume “fear is extreme, so a rebound is near.” Sometimes a rebound comes. Sometimes it doesn’t. Volatility can remain high while price continues to grind lower—or it can whip around as participants reposition. The rational response is to treat the VIX as a volatility expectation tool and manage risk accordingly, not as a timetable.
In real trading, this is where discipline gets tested. People want simple stories: “VIX is high, therefore the bottom is in.” Markets rarely agree to that script. A spike can reflect the market’s demand for protection, changes in hedging flows, and repricing of future uncertainty. Even if fear looks “extreme” relative to recent levels, the market can keep repricing volatility until conditions stabilize.
Scenario 3: VIX back to normal, hedges start to hurt
After a stressed period, implied volatility can collapse. If you bought long volatility protection (directly or indirectly), the position might lose value even if you hedged successfully. That’s not a failure of your decision—it’s how volatility instruments work: you’re paying for expected volatility. If realized volatility comes in lower than implied, the hedge can “cost” you. Investors need to plan for that reality rather than being shocked by it.
This scenario is also where many investors learn the difference between protection that works during stress and protection that always makes money. A hedge can do its job while still being expensive in mark-to-market terms. The cost shows up when implied volatility reverts. That’s normal. The trick is to factor it into expected outcomes and not treat it like a surprise bill from the universe.
How Traders and Investors Usually Interpret the VIX Signal
Once you get past the basics, the VIX tends to get used in a few consistent patterns. You’ll see the same themes in risk reports and trading desk notes.
Volatility regime awareness
The most common use is identifying whether the market is in a volatility regime that matches your strategy. Trend-following systems, for example, often behave differently when volatility rises. Mean-reversion strategies might also need recalibration. The VIX helps you label the current environment.
There’s a practical reason this works. Many strategy assumptions depend on how fast and how far prices move. Volatility affects that directly. Even if a model can handle direction changes, it might struggle when the “movement width” changes. The VIX acts as a convenient proxy for that width.
Hedging cost awareness
For options traders, the VIX is related to implied volatility levels. If the VIX is high, the market is charging more for volatility exposure. That can affect choosing strike prices, expiration dates, and hedge ratios. If you’ve ever bought an option and watched it decay faster than your patience, you understand the idea—higher volatility can mean higher option premiums, and that can change your expected outcomes.
Another nuance: the option premium isn’t just about volatility level; it also reflects how traders think volatility will change over time. That shows up in the term structure and in the pricing of options across strikes. The VIX abstracts this into one number for quick comparison, but you still need the option chain to execute trades intelligently.
Risk appetite signals
Beyond the math, VIX reflects how much participants are willing to pay for protection. If the VIX rises because puts are becoming expensive relative to calls (or because the broader implied volatility surface shifts), it’s often the market’s way of saying risk appetite has cooled.
In periods where investors rotate into “safety,” you’ll see the VIX and other substitutes for risk sentiment move together. That said, the VIX can also rise during rallies if investors scramble for protection against big downside tail risks. So again: volatility expectation can increase without an immediate bearish price outcome.
Limitations Revisited: What the VIX Doesn’t Tell You
Because the VIX gets described as “fear,” it’s easy to assume it captures everything about sentiment. It doesn’t.
The index:
- doesn’t directly measure liquidity stress in every market segment
- doesn’t tell you whether investors are afraid of earnings, rates, credit, or geopolitics—just that volatility expectations are elevated
- doesn’t reveal the entire distribution of possible returns; it compresses a lot of option pricing information into a single number
That means the VIX works best as an input to a broader decision-making process. Ignoring other signals can be costly. Overweighing VIX can also be costly. The trick is balance, and yes, “balance” is one of those words that gets overused. In this case, it’s still the right advice.
It also helps to remember that the VIX is tied specifically to S&P 500 index options. If your exposure is concentrated elsewhere—individual stocks, sector ETFs, credit spreads—the VIX is still a useful reference point, but it’s not guaranteed to match what you own. You can treat it as a market-wide signal, not a personal dashboard for your portfolio.
Lastly, the VIX tells you what implied volatility is for the specific model assumptions behind option pricing. Options markets embed assumptions about risk premia, expectations, and hedging flows. No single index can replace understanding those mechanics.
Conclusion
The VIX Index earns its reputation because it translates option market pricing into a practical expectation for 30-day volatility. It’s not a directional forecast, and it won’t prevent bad calls from happening. But it provides a consistent, widely used indicator of how much price movement investors expect, and that makes it valuable for risk management and trading context.
If you want to use it well, treat the VIX as information about volatility expectations—not as a prophecy. Pair it with market structure, price action, and the specific time horizon relevant to your positions. And if you step into VIX derivatives, be mindful of product mechanics and holding period effects, because volatility products don’t behave like stocks. A little respect goes a long way.
For most people, the best starting approach is simple: monitor the VIX for regime changes, understand what a rising or falling VIX implies about implied volatility, and only then decide whether to hedge, adjust exposure, or stay put. That’s not glamorous, but it’s how you avoid turning “fear gauge” into “fear strategy.”