
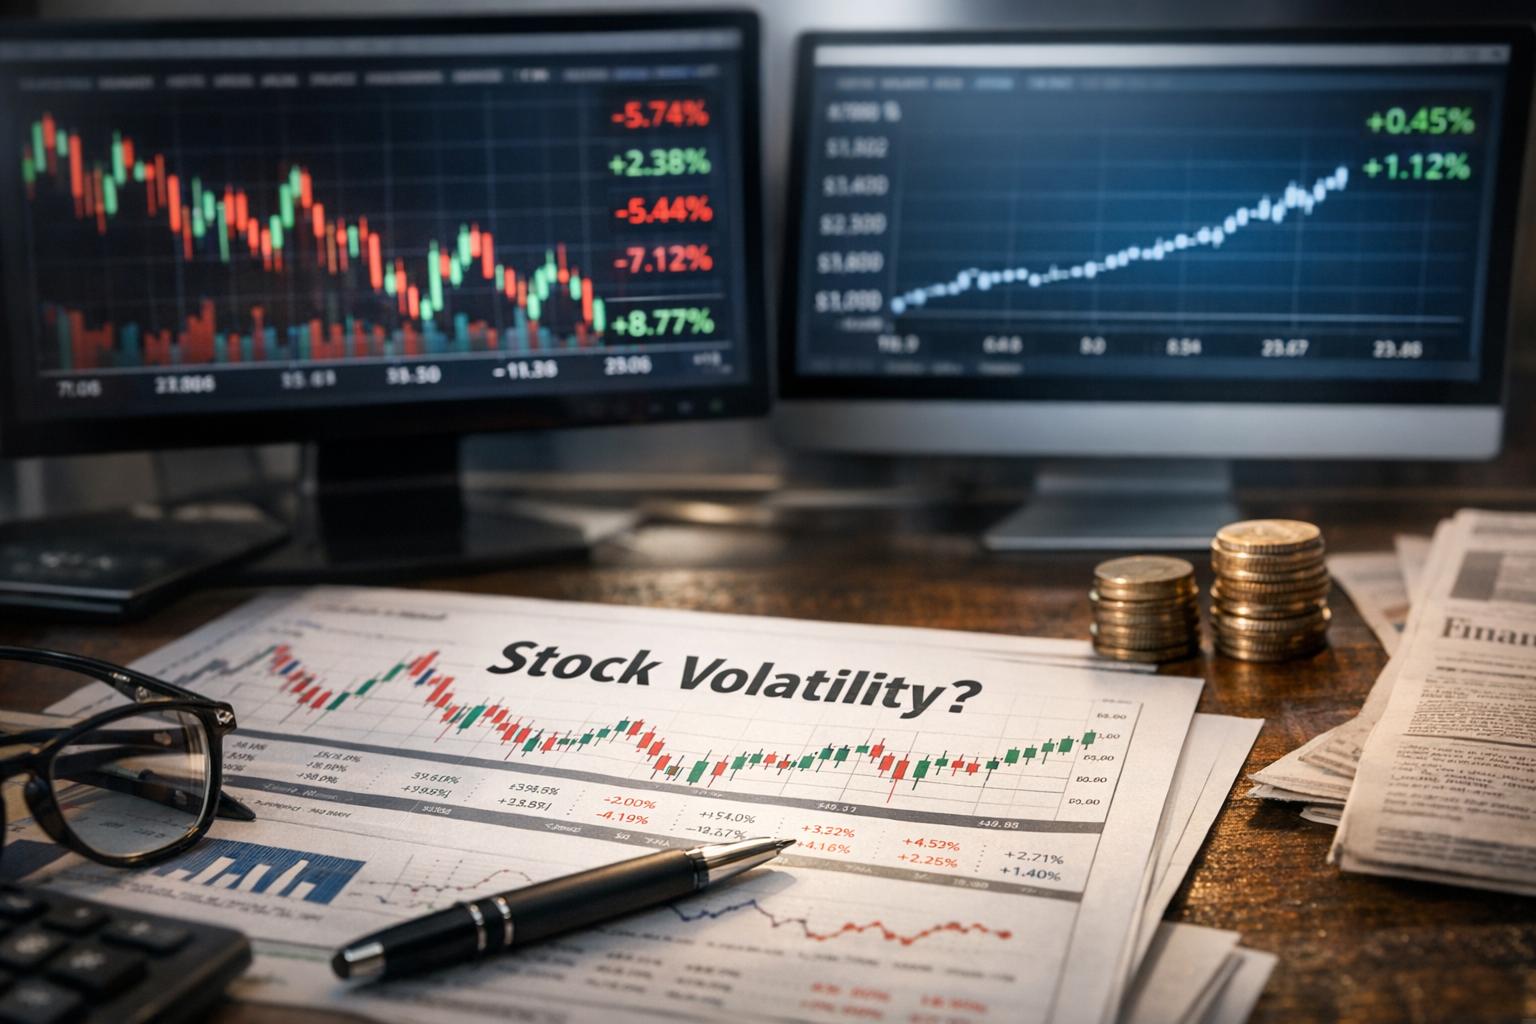
Understanding Stock Volatility
Stock market volatility is one of those terms people toss around like it’s self-explanatory. It’s not. If you invest for long enough—or trade often enough—you’ll notice that some stocks move like a calm pond, while others look like they’re trying to qualify for a roller coaster ride. Volatility is the reason for that difference, and understanding it helps you avoid the classic mistake: confusing “a good company” with “a comfortable stock.”
At its simplest, volatility is the degree of variation in the price of a financial instrument over time. When prices swing a lot, volatility is high. When prices move steadily, volatility is lower. For investors, volatility matters because it acts like a measure of uncertainty. Higher volatility usually means higher risk of losses in the short term, even if the company is solid. The tricky part is that volatility also creates opportunity—sometimes for gains, sometimes for pain, depending on what you do with it.
Volatility vs. Risk: They’re Related, Not Identical
People often treat volatility and risk as the same thing. They’re not.
– Volatility describes how much prices change, generally over a set period.
– Risk is about the chance and severity of losing money relative to your goals.
A stock can be volatile but still trend upward over years. Another stock might show lower short-term volatility but still drop meaningfully during a market regime change. So, volatility is a useful “temperature check” for uncertainty, but you still need to consider fundamentals, time horizon, and portfolio construction.
If you’ve ever watched an “almost good” stock keep sliding while you held out hope, you already learned that volatility can test patience. That’s why investors treat volatility as both a warning signal and, in some strategies, a trading tool.
How Volatility Shows Up in Real Pricing
Volatility doesn’t only show as dramatic single-day moves. It often shows up as patterns like:
– wider swings between daily highs and lows,
– more frequent sharp reversals,
– larger gaps around major news (earnings, guidance changes, lawsuits),
– faster reactions to macro headlines (rates, inflation, employment data).
Even if the long-term story looks unchanged, the path the price takes can be rocky. That path matters for anyone who might need to sell before the “long term” arrives.
Factors Influencing Stock Volatility
Several factors contribute to the volatility of stocks, each adding its own layer of complexity to market dynamics. Below, we delve into these various elements:
1. Company Size and Market Capitalization: One of the primary factors affecting stock volatility is the size of the company, often represented by its market capitalization. Small-cap stocks, which belong to smaller companies, tend to exhibit higher volatility. This increased volatility can be attributed to their generally lower trading volumes and greater sensitivity to market sentiment. When there’s less trading activity, the price has fewer “anchors,” so a modest amount of buying or selling can move the stock more than you’d expect.
Small caps can also face bigger uncertainty around growth, profitability, funding needs, and customer concentration. Investors may change their minds quickly because the stakes feel higher and the information flow can be less consistent. In plain terms: if the company is still proving itself, the stock may react more dramatically when new data lands—good or bad.
On the other hand, large-cap stocks, typically representing more established companies, often experience less volatility due to their stability and more extensive trading volumes. Large companies usually have:
– more analysts covering them,
– broader investor ownership,
– deeper liquidity support,
– more stable revenue streams.
That doesn’t make large caps immune to big moves, but it often makes their day-to-day price changes less wild.
2. Industry Sector: The industry sector within which a company operates is another critical determinant of its stock’s volatility. For instance, stocks in the technology or biotechnology sectors are frequently more volatile owing to their exposure to rapid innovation cycles and regulatory hurdles. These industries are characterized by constant change and advancement, making them inherently risky. A single news item—like a trial result, product delay, or regulatory decision—can reprice expectations fast.
Biotech is a particularly good example of volatility driven by “event risk.” Clinical trial results and FDA decisions can shift a company’s perceived odds overnight. That kind of “binary-ish” outcome tends to produce big swings.
Conversely, utility companies, which generally have stable demand and operate under regulated pricing structures, often experience lower volatility. Their stability makes them less susceptible to frequent price swings. Utilities may still move when interest rates shift, but their fundamental cash flows often change slowly compared with sectors driven by rapid R&D outcomes.
3. Economic Factors: Macro-economic conditions play a significant role in affecting stock volatility. Various economic factors, such as interest rates, inflation rates, and the overall economic climate, can have a profound impact on stock prices. Stocks in sectors that are particularly sensitive to economic conditions, such as consumer discretionary and financial services, often display more volatility during economic downturns.
When the economy softens, consumers cut spending, credit standards tighten, and earnings assumptions get revised. Financial services can also react to shifts in loan demand, net interest margins, and default rates. Because these changes ripple quickly through expectations, stocks tied to them often swing more than defensive sectors.
Economic news can also change the market’s “discount rate”—the interest rate investors use mentally when deciding what future profits are worth today. When discount rates move, growth assumptions can be repriced quickly, especially for companies with far-dated earnings potential.
Market Sentiment and Speculation
Market sentiment is another powerful force that drives stock volatility. The collective mood and perception of investors can cause stock prices to rise or fall unpredictably, especially in stocks with a high degree of speculative interest. In other words: sometimes the stock reflects what traders think will happen next, not what the business is doing right now.
This phenomenon is often observed during news releases, earnings reports, or unforeseen geopolitical events. The value of a stock can fluctuate dramatically, sometimes irrespective of the company’s actual performance. A company might beat earnings but still drop if guidance disappoints. Or it might miss slightly yet surge if investors interpret the miss as temporary.
A useful measure of a stock’s sensitivity to market movements is its beta value. A high beta value typically indicates a stock that is more volatile than the market, making it exceedingly reactive to market sentiment and speculation. Beta isn’t magic, but it’s a handy starting point for understanding whether a stock tends to amplify broader market moves.
There’s also a behavioral side. Markets can overreact—sometimes to headlines, sometimes to momentum. When enough traders pile in, the move can intensify. Later, when reality reasserts itself, the price can reverse sharply, which is another way volatility shows up.
Liquidity and Trading Volume
Liquidity, defined as the ease with which a stock can be bought or sold without significantly impacting its price, is another factor that influences stock volatility. Stocks with low trading volumes often experience sharp price changes when large orders are placed. It’s similar to trying to move a boat in shallow water: small pushes matter a lot.
If there are few shares changing hands, a relatively modest order can clear available liquidity at one price and jump the next available trade to a different level. That creates volatility that isn’t necessarily “about” the company—sometimes it’s about market mechanics.
In contrast, stocks that are highly liquid, i.e., those that trade in large volumes without substantial price variation, tend to have more moderated price movements. Liquidity tends to act like shock absorbers. Many buyers and sellers mean prices adjust gradually rather than jumping.
Another practical detail for investors: low liquidity can also increase trading costs via wider bid-ask spreads. Those costs can bite into returns, particularly for shorter-term strategies. Even long-term investors sometimes forget that liquidity affects what you actually pay when you enter and exit a position.
Government and Regulatory Impact
The role of government and regulatory bodies cannot be underestimated when considering stock volatility. Changes in government policy, taxation, tariffs, or new regulatory measures can introduce uncertainty into the market, thereby affecting stock prices. When such changes occur, investors often reassess the future prospects of companies impacted by these policies, leading to fluctuating stock prices.
In some sectors, regulatory outcomes determine business viability more than typical business performance metrics. For example, legislation affecting healthcare coverage, emissions standards, or data privacy can materially change revenue expectations. The market reacts because earnings forecasts get revised quickly, and traders position themselves around those revised expectations.
Staying informed about government policies and potential regulatory changes is essential for anticipating potential volatility. You don’t need to read every law document, but you should track reputable summaries and understand which sectors tend to be most sensitive to policy changes.
How Volatility Gets Measured (Without the Math Headache)
Volatility can be measured in different ways, and you don’t need to become a quant to use it intelligently. The most common idea behind measuring volatility is simple: how much did price vary over a period?
Traders and analysts often use metrics such as:
– standard deviation of returns (a statistical measure of spread),
– implied volatility (a market-based expectation extracted from options prices),
– beta (how much a stock tends to move relative to the overall market),
– average true range (ATR), which looks at price movement ranges.
Implied volatility is worth a short explanation because it’s often misunderstood. It’s “implied” by option prices. Options markets price in expected future variability. So, when implied volatility rises, it usually reflects expectation of bigger moves ahead—often around earnings or major decision dates.
This matters because implied volatility can increase even if historical volatility hasn’t changed much. The market may be pricing upcoming uncertainty. If you’ve ever seen an options-based strategy react to a headline before the stock really moves, that’s the idea in action.
Why Some Stocks Stay Volatile for Years
Many investors expect volatility to fade once uncertainty clears. Sometimes it does. Sometimes it doesn’t, because volatility can be structural rather than temporary.
A stock can remain volatile because:
– its business model has inherently variable results (commodity exposure, royalties, ad cycles),
– it relies on ongoing catalysts (product launches, trials, renewals),
– it operates with uncertain margins or funding needs,
– the investor base is heavily momentum-driven,
– the company is still in a “storytelling” stage (the market is pricing growth probabilities rather than present profits).
So, a biotech stock isn’t volatile only because of one trial. It’s volatile because the market is always waiting for the next binary event. A high-growth tech stock can be volatile because expectations for future growth are constantly shifting.
Volatility and Market Regimes
Volatility doesn’t behave the same way in every market environment. In calm periods, dispersion between stocks may be lower—everyone’s pretty relaxed. In stressed periods, volatility can rise across the board.
That doesn’t mean every stock becomes equally volatile. It means correlations increase: stocks start moving together more often, and the diversification benefits of holding many stocks can shrink. If that sounds like an unpleasant time to need your portfolio to behave predictably, well—yes.
During risk-off regimes, investors tend to:
– reduce exposure to uncertain future cash flows,
– sell speculative names first,
– demand higher risk premiums,
– reassess liquidity needs.
High-volatility stocks can drop harder because they’re often valued more on expectations than on current stable earnings. Even if a company’s fundamentals don’t change much overnight, sentiment changes can hit the stock price immediately.
Practical Examples: How Volatility Affects Decisions
Let’s make this concrete. Suppose you’re evaluating two stocks in different ways—one is a large, established consumer brand, the other is a smaller growth company in a developing market.
Example 1: Holding period mismatch
You plan to sell within three months to fund something real (a home down payment, maybe). The growth company has high historical volatility. Even if you think the long-term thesis is decent, you risk being forced to sell during a dip. The consumer brand may also decline, but your chance of “getting lucky” on timing changes.
Example 2: Earnings calendar risk
You invest right before earnings because you “feel” comfortable with the story. If implied volatility spikes due to the upcoming report, option prices reflect the expectation of a big move. If you’re holding shares, the stock can still do what the market expects: sharply up or down. Volatility means you must be honest about what happens if the price moves against you.
Example 3: Liquidity traps
You buy a smaller stock that fits your thesis, but trading in it is thin. On a bad day, you want to exit, but the spread widens and the price jumps. That increases your real-world cost. Volatility isn’t just a graph trend; it can affect execution.
These scenarios are why experienced investors don’t just ask “Will the company succeed?” They also ask “How will the stock behave while I wait?”
How Investors Can Approach Volatile Stocks
Some people react to volatility by doing extreme things: either panic-selling at the first wobble or buying aggressively because the price is “cheap.” Neither approach works consistently.
A better approach is to match your strategy to volatility:
1) Align your time horizon with the stock’s behavior
If the stock tends to swing wildly, your time horizon should often be longer. A long horizon gives volatility less power over your decisions. For shorter horizons, you need a plan for what happens if the stock moves against you.
2) Use position sizing as a risk control tool
Even a high-quality company can produce ugly short-term price action. Position sizing limits the damage if volatility causes a drawdown. Many investors accidentally size positions based on conviction alone. Liquidity and volatility deserve a seat at that table too.
3) Watch volatility signals around events
Earnings, guidance updates, regulatory deadlines, and major macro data can increase volatility. If you know a catalyst is coming, you can avoid making emotional decisions during the volatility spike. Sometimes the best move is waiting a bit rather than “pressing the button.”
4) Compare volatility with fundamentals, not vibes
Volatility without explanation is noise. Volatility with a driver—like regulation, commodity prices, or product trial outcomes—can be understood and accounted for. If you can’t articulate why a stock is volatile, you’re relying on guesswork.
Common Misconceptions About Stock Volatility
Let’s clear up a few recurring myths.
“High volatility always means a bad stock.”
No. Some great companies remain volatile because the market is pricing uncertainty or future growth. High volatility can also mean there are frequent opportunities to buy and sell with good discipline.
“Low volatility means safety.”
Low volatility doesn’t guarantee low risk. A stock can be stable day-to-day and still drop meaningfully due to a fundamental break, earnings collapse, or a shift in investor perception. It just may not look dramatic in the daily chart until it does.
“Volatility is random.”
Not really. Volatility has causes—company-specific catalysts, sector dynamics, macro sensitivity, liquidity conditions, and sentiment. Sometimes those causes are hard to predict, but the pattern usually has structure.
“Beta tells the whole story.”
Beta can help, but it focuses on market-relative movement. It doesn’t fully capture company-specific risk, liquidity concerns, or event-driven volatility. Use it as one input, not the decision-maker.
How to Monitor Volatility Over Time
Volatility isn’t fixed forever. A stock that’s been calm can suddenly get jumpy after a leadership change, a new product cycle, or a regulatory problem. Meanwhile, a historically volatile stock can quiet down if uncertainties clear.
A sensible monitoring approach includes:
– reviewing how volatility changes around earnings,
– tracking whether liquidity improves or worsens,
– comparing implied volatility versus historical volatility when options data is available,
– watching for regime changes in the overall market.
You don’t need to build a surveillance room. But you do need to notice trends. If you keep treating volatility as “something that just happens,” you’ll miss when it starts behaving differently.
Where Volatility Matters Most for Different Types of Investors
Different investors feel volatility differently.
Long-term investors
For long-term investors, volatility affects:
– entry timing and whether you accumulate through dips,
– emotional endurance (yes, really),
– whether you stick to your plan when prices move fast.
Long-term doesn’t mean you ignore volatility. It means you handle it via timing, diversification, and patience.
Short-term traders
For traders, volatility isn’t just risk—it’s the “product.” They often rely on volatility forecasts, option pricing, and price movement ranges to plan entries and exits. Still, their main enemy is trying to predict direction without respecting volatility behavior.
Income-focused investors
Income investors—those who prioritize dividends or interest-like returns—need to watch how volatility affects:
– payout safety and capital preservation,
– total return (price changes can overpower dividend income),
– refinancing risk for certain sectors.
A dividend that looks fine might still be threatened if volatility reflects deteriorating financial health. So, check fundamentals, not only the yield.
Risk Management for Volatile Markets (Practical and Not Too Fancy)
There’s a temptation to believe that risk management requires complex models. Sometimes it does, but for many investors, the basics work surprisingly well.
Consider these practical habits:
– Have a plan for what price movement would make you reconsider your thesis.
– Avoid tying all decisions to one information update.
– Keep enough liquidity (cash or liquid holdings) so you’re not forced to sell during a volatility spike.
– Diversify so a single volatile position doesn’t dominate your outcomes.
If you’ve ever had to sell at the worst time, you already know why liquidity and planning matter. Volatility punishes improvisation.
Staying Informed Without Losing Your Mind
Because volatility often responds to news, it can feel like the market is constantly shouting. The solution isn’t to watch endless feeds until you’re exhausted. It’s to track the specific drivers that matter for the stocks you own or follow.
For many investors, that means knowing:
– the company’s upcoming catalysts (earnings, trials, regulatory dates),
– which macro factors tend to move the stock or sector,
– whether sentiment has shifted due to changes in guidance or fundamentals.
Financial news sources and research reports can help here. If you’re uncertain, speaking with an experienced financial advisor can also provide structure. Not everyone needs that step, but it can reduce costly misinterpretations—especially around earnings and headline-driven volatility.
Looking Back at Volatility: What You Learn After the Fact
Volatility always looks more intense once you’ve lived through it a few times. You start noticing patterns, like how certain sectors react faster, how liquidity changes during stress, and how sentiment can override fundamentals for short bursts.
That experience is useful. It makes you more disciplined about what belongs in your decision process:
– fundamentals for the long-run picture,
– volatility for the timing and risk picture,
– and your own temperament for whether you’ll actually follow your plan.
Closing Thoughts on Understanding Stock Volatility
Understanding these diverse factors is crucial for investors who aim to handle volatility rather than fear it. By being aware of what drives volatility, investors can make more informed decisions about which stocks to include in their portfolios. It is also important for investors to assess their own risk tolerance and investment goals while dealing with volatile markets.
For those who want more detailed insights and strategies, consulting reputable financial news sources or engaging with experienced financial advisors can provide valuable guidance. And if nothing else, remember this: markets don’t owe you a smooth ride. The investors who do well around volatility are usually the ones who plan for the bumps.