
Understanding Gap-and-Go Stocks
In the context of active equity trading, a gap-and-go strategy refers to a method that attempts to capitalize on a stock that opens significantly above or below its prior day’s closing price and then continues moving in that same direction. The approach is most commonly associated with day trading, where positions are opened and closed within the same session. The central objective is to identify whether an initial imbalance between supply and demand at the opening bell is likely to persist long enough to produce a sustained intraday move.
Price gaps occur regularly across different markets and timeframes, but morning gaps in equities are particularly relevant because of the structured nature of stock market trading hours. Since most exchanges close overnight, new information accumulates when regular trading is halted. When trading resumes, prices adjust rapidly to reflect that information. Understanding which of these adjustments are likely to produce continuation and which are prone to reversal is fundamental to applying a gap-and-go framework systematically.
Market Structure and Why Gaps Occur
Equity markets typically operate during defined hours, such as 9:30 a.m. to 4:00 p.m. Eastern Time in the United States. Outside these hours, pre-market and after-hours trading sessions allow for limited participation, often with reduced liquidity. Institutional investors, hedge funds, and other participants respond to corporate announcements, macroeconomic reports, geopolitical developments, and sector-specific events that occur while the primary market is closed.
Because order flow continues outside regular hours, a stock’s fair value may shift before the official open. If a large imbalance of buy or sell orders exists at the open, the stock may begin trading at a price significantly different from where it previously closed. This price discontinuity is visually represented on a chart as a gap between two candlesticks or price bars.
The magnitude of the gap often reflects the perceived significance of new information. However, not all gaps are structurally equivalent. Liquidity, float size, institutional positioning, and broader market conditions all influence whether the gap represents a durable repricing or a temporary imbalance.
Types of Morning Gaps
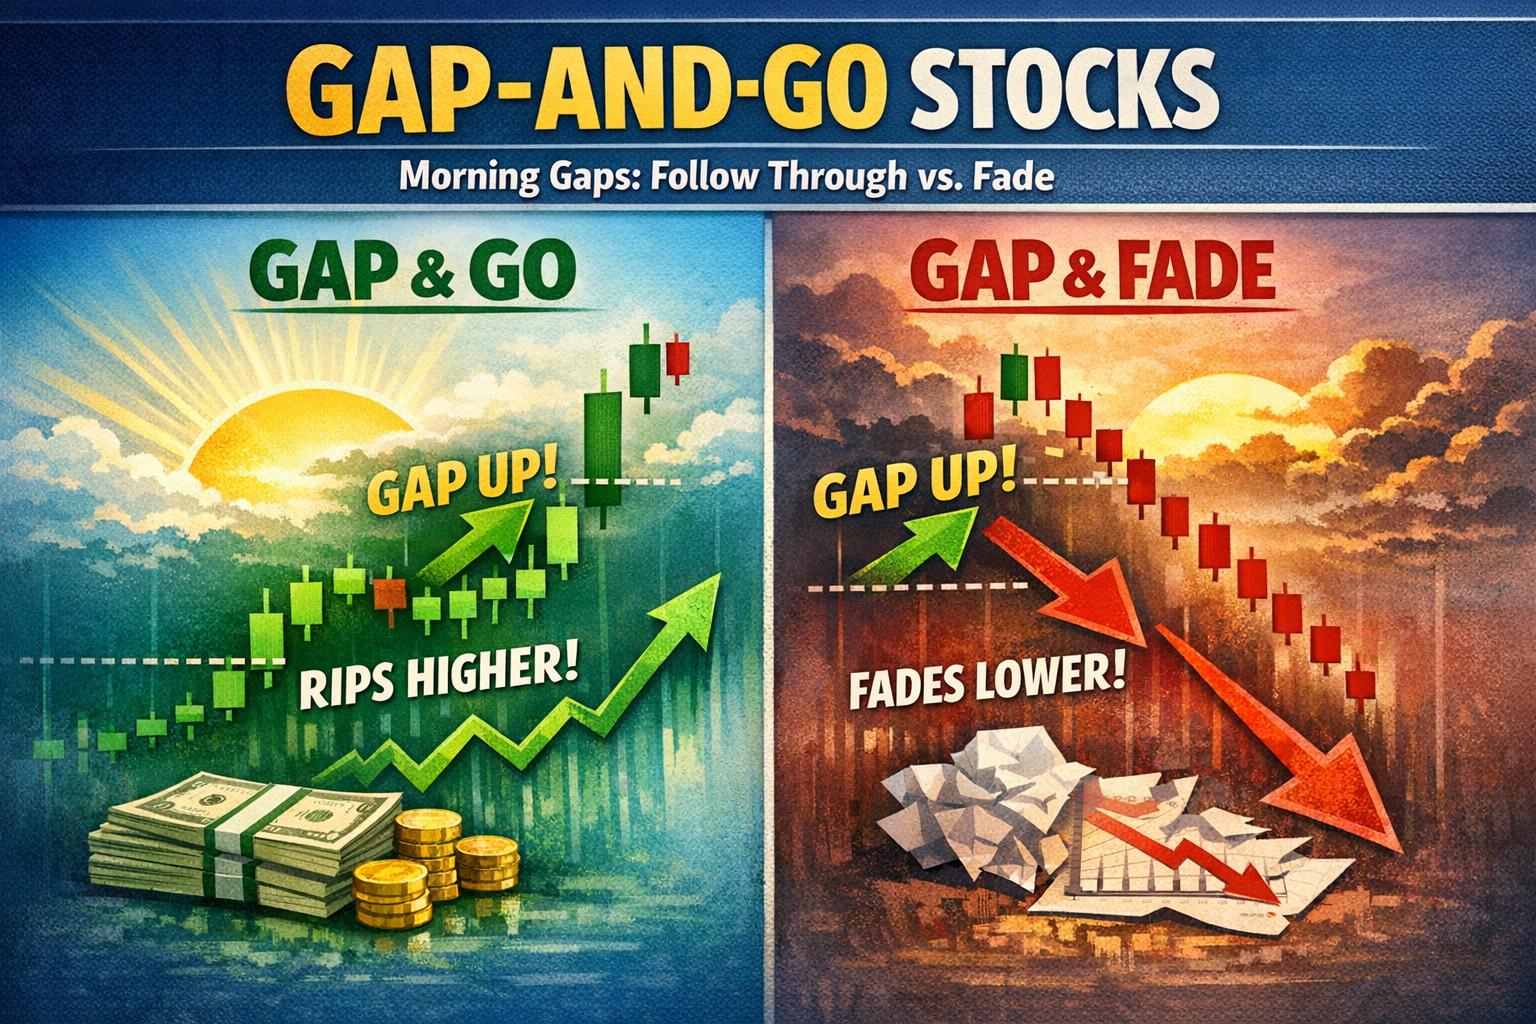
Morning gaps fall into two primary categories:
1. Gap Up: The stock opens at a price higher than its previous closing price. This typically indicates aggressive buying interest or strong demand based on new information.
2. Gap Down: The stock opens at a price lower than its previous closing price. This reflects aggressive selling pressure or negative reassessment of the company’s prospects.
From a broader technical perspective, gaps can also be classified as breakaway gaps, continuation gaps, exhaustion gaps, or common gaps. A breakaway gap occurs when price leaves a well-defined range, often signaling a change in trend. Continuation gaps appear within an existing trend and suggest sustained momentum. Exhaustion gaps may signal the end of a trend, while common gaps often occur without strong catalysts and are frequently filled.
The gap-and-go approach typically seeks breakaway and continuation gaps rather than common or exhaustion gaps.
Core Principles of the Gap-and-Go Strategy
The gap-and-go strategy is based on the assumption that strong directional pressure at the open can produce a feedback loop. Early traders enter in the direction of the gap, drawing in momentum participants. This increased participation may further expand the price movement, at least temporarily.
Execution generally occurs within the first hour of trading, although some traders focus specifically on the first 5 to 30 minutes. The strategy requires rapid decision-making and clearly defined criteria, as volatility is often elevated shortly after the market opens.
Several structural elements define a gap-and-go setup:
- A measurable percentage gap relative to the prior close
- Pre-market volume significantly above average
- A clear catalyst that explains the move
- Price holding above (or below) key pre-market reference levels
Traders often monitor pre-market highs and lows, as these levels may serve as early support or resistance once regular trading begins.
When Gaps Follow Through
Not all gaps continue in the direction of the open. Identifying when follow-through is likely requires consideration of multiple confirming factors.
Strong Catalyst: Earnings surprises, raised guidance, regulatory approvals, mergers, sector upgrades, or macroeconomic developments can alter valuation frameworks. When institutional participants adjust positions based on fundamentally meaningful data, the resulting demand or supply imbalance may persist beyond the opening auction.
High Relative Volume: Volume is a primary confirmation tool. If early-session volume significantly exceeds the stock’s average, it suggests broad participation. Institutional involvement is particularly important, as institutions control a substantial proportion of total market volume. Sustained institutional activity increases the probability of continuation.
Market Trend Alignment: If a stock gaps up during a broader bullish market phase, general risk appetite may support additional buying. Conversely, a gap down aligned with a weak broad index environment may experience sustained selling. Alignment reduces countertrend pressure.
Float and Liquidity Considerations: Stocks with smaller public floats may experience more pronounced moves because fewer shares are available to absorb demand. However, this also increases volatility. Larger-cap stocks often require significantly higher volume to maintain continuation, but they may offer more orderly price action.
Holding Key Levels: When price consolidates near the top of the opening range instead of retracing immediately toward the prior close, it may indicate that buyers are absorbing available supply. This behavior can precede another expansion phase.
Opening Range Dynamics
The opening range, often defined as the high and low of the first 5, 15, or 30 minutes of trading, serves as an important reference. A breakout above the opening range high on strong volume can confirm continuation after a gap up. Similarly, a breakdown below the opening range low can confirm continuation after a gap down.
False breakouts are common when volume declines or when broader market conditions become contradictory. For this reason, some traders wait for consolidation before entering, rather than participating immediately at the open.
When Gaps Fade
Gap fades occur when the stock reverses direction and retraces toward, or fully fills, the prior session’s closing price. This phenomenon is sometimes described as “filling the gap.”
Several factors increase the likelihood of a fade:
Lack of Substantive News: If the gap is driven primarily by speculative activity, low-credibility news sources, or general market volatility rather than company-specific developments, early enthusiasm may dissipate.
Extended Technical Conditions: A stock that gaps up after multiple consecutive green sessions might attract profit-taking. Technical conditions such as overbought readings on oscillators like the Relative Strength Index (RSI) can contribute to this behavior.
Low Early Volume: A visible gap without strong participation suggests that the move may lack institutional sponsorship. Retail participation alone may be insufficient to sustain momentum.
Higher Timeframe Resistance: If the gap pushes price directly into a significant daily or weekly resistance level, sellers who previously entered positions at that level may exit, increasing supply.
Broader Market Reversal: Even a technically strong gap can fade if the overall market shifts direction due to unexpected macroeconomic data or policy statements.
In some trading methodologies, fading the gap is a distinct strategy. Traders wait for confirmation of breakdown below the session’s early support in a gap-up scenario or for rejection above resistance in a gap-down scenario.
Volume Analysis in Depth
Volume is a central analytical variable in gap trading. Rather than simply evaluating absolute share count, traders often use relative volume, which compares current activity to historical averages for the same time of day.
Key volume-related observations include:
- Acceleration of volume into breakouts
- Volume contraction during consolidations
- Climactic spikes that may signal exhaustion
Sustained continuation typically requires consistent participation throughout the morning. A sharp initial surge followed by rapid decline in activity may indicate that initial order imbalance has been absorbed.
Technical Tools and Indicators
Although price action and volume are primary inputs, many traders incorporate additional technical analysis tools.
Moving Averages: Intraday moving averages such as the 9-period and 20-period exponential moving averages can help identify short-term trend direction. On higher timeframes, the 50-day and 200-day moving averages represent widely observed support and resistance areas.
Relative Strength Index (RSI): RSI readings above 70 or below 30 are commonly interpreted as overbought or oversold, though in strong trends RSI can remain elevated or depressed for extended periods.
VWAP (Volume Weighted Average Price): The VWAP is frequently used by institutional traders as a benchmark. Holding above VWAP after a gap up may suggest institutional support, while trading below it may indicate weakness.
MACD (Moving Average Convergence Divergence): MACD crossovers can provide supplementary confirmation, though lag is inherent in most momentum indicators.
Indicators should not replace contextual analysis. They are most effective when used in combination with price structure and event awareness.
Risk Management Considerations
Due to elevated volatility, risk management is critical in gap trading. Defined position sizing, predetermined stop-loss levels, and adherence to maximum daily loss thresholds are commonly employed practices.
Stops may be placed:
- Below the pre-market low (for long positions)
- Below the opening range low
- At a fixed percentage loss threshold
Profit targets may be based on prior daily resistance levels, measured moves equal to the size of the initial range expansion, or trailing stop methodologies. The appropriate approach depends on volatility and liquidity conditions.
Because price can move rapidly, slippage is a relevant operational factor, particularly in lower-liquidity securities.
Time-of-Day Effects
Empirical observation indicates that volatility is often highest during the first and last hour of the trading session. Midday trading frequently exhibits reduced range and lower volume. For gap-and-go traders, the first 30 to 90 minutes often present the clearest opportunities, as that is when the initial imbalance is most actively resolved.
If a stock has not demonstrated directional resolution by midday, continuation probability may decline. However, secondary afternoon breakouts can occur if new information emerges or if broader market momentum shifts.
Differences Between Large-Cap and Small-Cap Gaps
Large-cap stocks tend to have deeper liquidity, tighter spreads, and more stable pricing increments. As a result, continuation moves may be smaller in percentage terms but can still be meaningful in absolute value.
Small-cap stocks may produce larger intraday percentage changes, particularly when float is limited. However, they also carry increased risk of rapid reversals, halts due to volatility, and wider bid-ask spreads.
Institutional participation patterns differ across capitalization tiers, and this affects both the reliability and magnitude of gap continuation.
Psychological and Behavioral Factors
Gap-and-go setups are influenced by behavioral dynamics such as fear of missing out, short covering, and forced liquidation. In a gap-up scenario, short sellers may be compelled to cover positions, adding incremental buying pressure. In a gap-down environment, margin calls or risk reductions may exacerbate selling.
Understanding positioning data, such as short interest levels, can provide additional context regarding potential accelerants. However, behavioral reactions are probabilistic rather than deterministic.
Data Review and Performance Evaluation
Systematic traders often maintain logs of gap behaviors across market cycles. Metrics tracked may include:
- Gap percentage magnitude
- Time to high or low of day
- Percentage of gaps that fill within the same session
- Volume relative to 30-day averages
Reviewing historical outcomes under different volatility regimes can improve the consistency of execution and refine entry criteria. Statistical evaluation helps convert discretionary observations into structured processes.
Conclusion
The gap-and-go strategy focuses on exploiting price discontinuities that occur at the start of the trading session. While gaps represent immediate repricing events, continuation is conditional upon factors such as catalyst strength, relative volume, broader market alignment, structural support levels, and liquidity.
Conversely, gaps lacking participation or fundamental justification frequently retrace toward the prior close. Differentiating between continuation and fade scenarios requires integration of price action, volume analysis, technical reference points, and contextual awareness.
Effective application depends not only on identifying high-probability conditions but also on disciplined risk management and consistent evaluation of outcomes. When approached systematically, gap trading can function as a defined intraday methodology within a broader trading framework.