
Understanding High-Volatility Stocks
High-volatility stocks tend to move more than the average stock—sometimes in a single day, sometimes over a single headline. You’ll see sharp rallies, sudden sell-offs, gaps at the open, and plenty of “wait, what just happened?” moments. For traders, volatility can be an advantage because it creates opportunities to enter and exit at better prices than you’d get in a calm market.
That said, high volatility is also where portfolios go to be stress-tested. The same price swings that can deliver quick gains can just as quickly erase weeks of progress. So if you’re looking at stocks known for aggressive price movement, you need a plan that treats risk as a daily operating system—not a suggestion you remember when things get calm.
This article breaks down how high-volatility stocks behave, what drives their movement, and—most importantly—how to manage that risk in a practical, repeatable way.
What “high-volatility” actually means
Volatility is basically how much a stock’s price changes over time. In plain English: if the stock’s price tends to jump around a lot, it’s high volatility.
Traders often look at volatility measures such as:
- Historical volatility: how much the price has moved in the past (usually measured over a time window)
- Implied volatility: derived from options prices, indicating how much the market expects the stock to move
- Average true range (ATR): a measure of average daily range that helps set trade levels
But you don’t have to memorize all formulas to use volatility. A practical rule: if the stock regularly swings more than the broader market, and those swings match with news cycles, earnings, macro events, or sentiment shifts, you’re dealing with high volatility.
Why these stocks move so aggressively
Price swings rarely happen “for no reason.” High-volatility stocks usually have one or more of the following traits:
1) Market speculation and thin liquidity
Some stocks trade in a way that allows fast price changes when buyers and sellers don’t overlap smoothly. Smaller-cap names, newly listed stocks, and companies with lower average volume can experience outsized moves. When liquidity is thinner, a modest flow of orders can push prices pretty far.
If you’ve ever watched a chart where the line looks like it’s been shaken instead of plotted, liquidity is often part of the story.
2) Earnings, guidance, and binary announcements
Earnings reports can create volatility because the outcome matters a lot. A company can beat expectations and still fall if guidance disappoints. Or it can miss and surge if the narrative changes (for example, margin improvement, cost cuts, or a major contract win).
Other “binary” events include FDA decisions (biotech), regulatory approvals (fintech/health/energy), mergers, major product launches, and large contract announcements.
3) Economic indicators and interest-rate sensitivity
Some stocks react more dramatically to macro data because their valuation depends heavily on discount rates, growth expectations, and risk appetite. If rates rise faster than expected, longer-duration growth stocks can take a hit. If recession fears fade, the reverse can happen just as quickly.
Even if you follow company fundamentals, macro shocks can overwhelm them in the short run.
4) Sentiment cycles and positioning
Sometimes volatility comes from crowd behavior. If a stock becomes extremely popular, the market can overshoot in both directions. When traders feel trapped, they may rush to exit. That “positioning unwind” can turn a normal correction into a fast drop.
This is why two stocks can look similar on a fundamentals basis but trade completely differently during stressful periods.
The double-edged sword: opportunity and risk
High volatility can help traders because it creates more frequent chances to:
- Identify breakouts and breakdowns
- Capture mean reversion moves (price returning toward a recent average)
- Work short-term trades around predictable event timing (earnings calendar, data releases)
- Use technical levels with wider room for movement (like support/resistance zones)
But risk rises too. Volatile stocks can:
- Gap past your stop-loss level (especially overnight)
- Trigger momentum trades and then reverse quickly
- Make it harder to judge “normal” versus “dangerous” movement
So the goal isn’t to avoid volatility—it’s to control your exposure to it.
Importance of Risk Management
Trading high-volatility stocks without risk management is like driving fast on a road you know has potholes. It can work—until it doesn’t. Risk management exists to prevent one bad trade from damaging your ability to trade tomorrow.
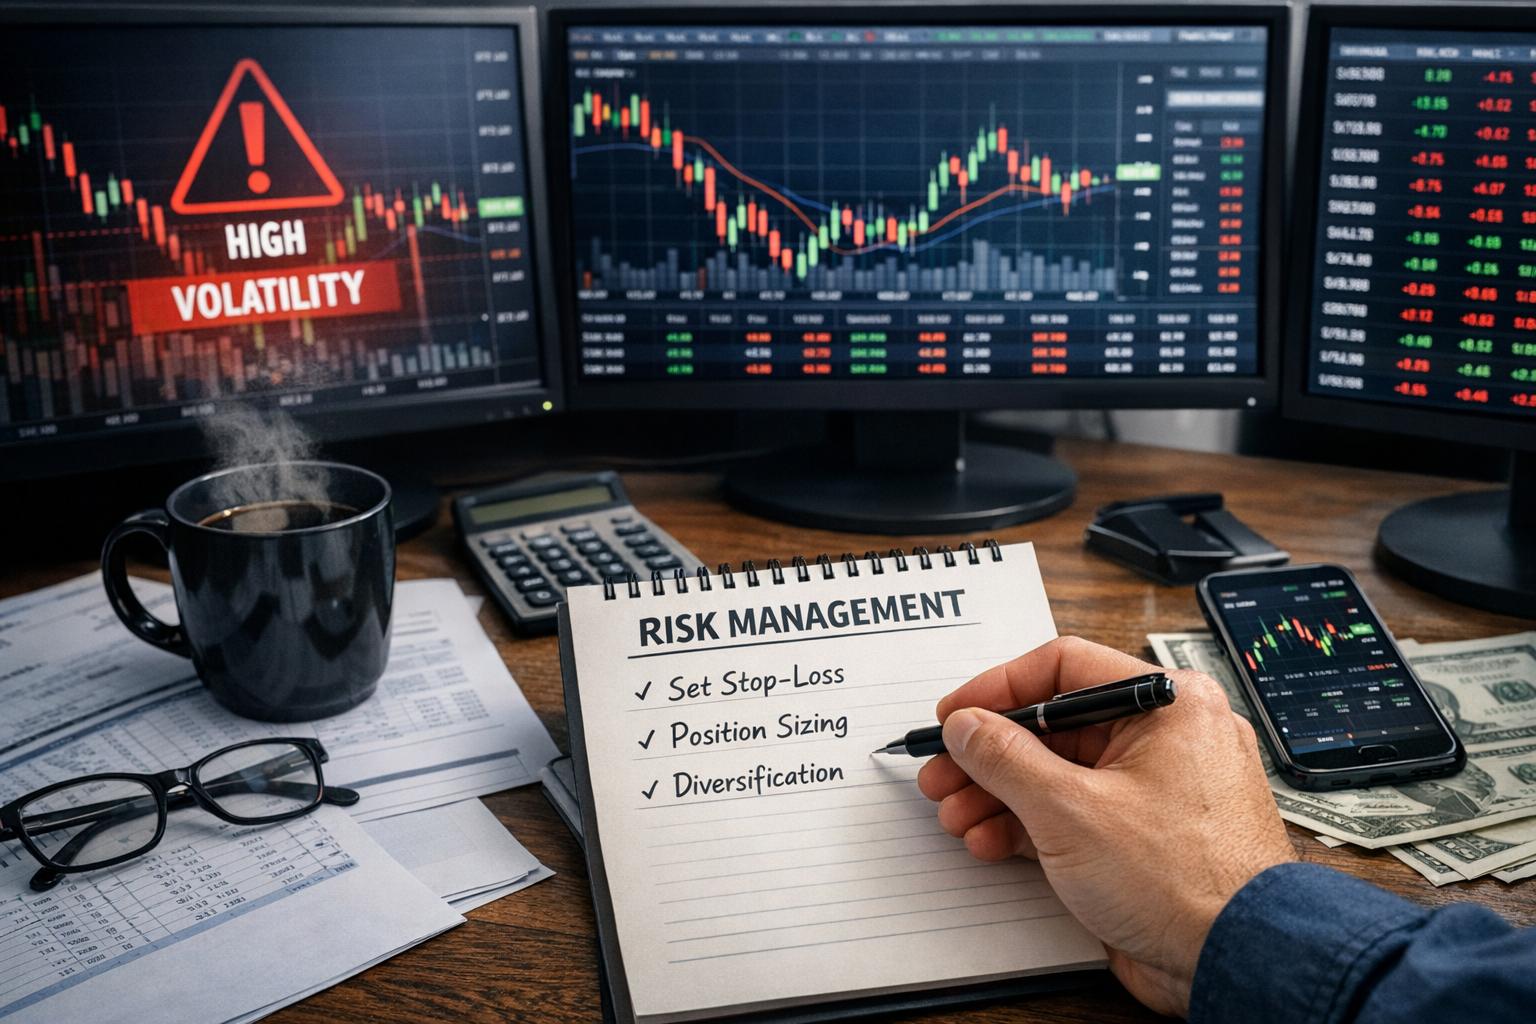
For volatile names, risk management plays three roles:
- Limits damage when the trade goes wrong
- Controls emotion by making decisions mechanical
- Preserves capital so you can continue learning and adjusting
If you’re building a trading plan, risk management isn’t a separate section on a checklist. It’s the structure underneath everything else.
Risk management should be measurable
A common mistake: thinking risk management means “I’ll be careful.” Carefully is vague. Vague is dangerous.
Instead, define risk in numbers you can track. Examples:
- Maximum loss per trade (in dollars or percentage)
- Maximum open risk at any moment (sum across positions)
- Maximum daily loss limit (so you stop trading when you’re rattled)
- Time-based rules or invalidation levels (when the trade thesis no longer holds)
Once you define those, volatility becomes just a parameter—not a panic button.
Diversification as a Risk Management Tool
Diversification spreads risk across different stocks, sectors, or strategies. The idea is simple: if one position gets hit hard, it doesn’t sink your whole account.
In practice, diversification helps most when your holdings don’t all react the same way to the same event. Some traders diversify across:
- Industries (tech, healthcare, industrials, energy)
- Market styles (growth vs. value, cyclical vs. defensive)
- Correlation levels (stocks that don’t always move together)
- Trade types (long positions, hedges, short-term tactical trades)
Diversification works because markets don’t all move identically
Diversification is based on the fact that different assets can respond differently to the same economic event. For example, a high-rate environment might pressure certain growth stocks but leave more value-oriented sectors less affected. Meanwhile, a commodity-related driver might boost energy and industrials while tech stumbles.
You’re not trying to predict the future. You’re trying to reduce the odds that one surprise ruins everything.
Watch out for the illusion of diversification
Here’s the part people forget: owning “different stocks” isn’t enough if they all depend on the same theme. For instance, if you own multiple high-volatility tech growth names, you might be diversified on paper but concentrated in one risk factor—like interest rates, revenue timing, or sentiment.
A useful question to ask before placing trades: “If the market shifts sharply, do all of these names get hit for the same reason?” If yes, diversification benefits shrink.
Position Sizing
Position sizing decides how big you make each trade. It determines how much of your capital is at risk if the stock moves against you.
For high-volatility stocks, position sizing matters more than usual because the distance to your stop and the speed of price changes are both likely to be larger.
How to size a trade for volatile names
A widely used method is to set a fixed percentage risk per trade. Example logic (not a rule you must follow): if your plan allows 1% risk on a trade, and your stop-loss is placed so that a move to that stop represents a 1% loss, then your share quantity follows automatically.
The inputs you need:
- Entry price
- Stop-loss level (or another invalidation point)
- Account size
- Max risk per trade
Once those are set, you can calculate position size. This approach keeps volatility from turning into account damage.
Limiting single-stock exposure
A common recommendation is to limit the maximum capital allocated to one high-volatility stock to a small fraction of the overall portfolio. The exact number depends on your style and risk tolerance, but the principle stays the same: avoid letting one idea dominate your results.
A useful way to think about it: you’re not trying to bet your trading career on a single candle.
Setting Stop-Loss Orders
Stop-loss orders are often treated like a safety net. But they’re not magic. They’re a rule you place on your broker system that says: “If price reaches X, exit my position.”
In volatile markets, two things matter:
- Price can move fast.
- Price can gap past your stop level.
So you should set stops based on your trading plan, not based on hope.
Where stops should come from
The stop-loss level should usually tie to your trade thesis through one of these:
- Technical invalidation (below support for a long, above resistance for a short)
- Volatility-based distance (using ATR or recent trading range)
- Time-based exit logic (if the move doesn’t happen within a set window)
If your stop is too tight, random noise will take you out. If it’s too wide, the trade becomes too costly when wrong.
Balancing protection and “breathing room”
Volatile stocks need room. Charts can look like they’re “wrong” for a while before they prove you right. That’s why the stop placement needs to reflect normal price movement.
A practical approach is to compare your stop distance to the stock’s typical daily range. If stop distance is smaller than what the stock usually does, you’re likely to get stopped out repeatedly even when the bigger trend eventually helps.
Other exit tactics beyond a single stop
Some traders use:
- Trailing stops once the trade reaches a profit threshold
- Partial exits (sell part of the position when price hits a target)
- Time stops (exit if momentum fades after a certain number of sessions)
None of these removes risk. But they can reduce the chances that you turn a manageable loss into a large one.
Utilizing Technical and Fundamental Analysis
Risk management limits damage—but analysis helps you decide what to trade in the first place. Technical and fundamental analysis serve different purposes and work better together than they do in isolation.
Technical analysis answers: “Where is price likely to go next, based on what it has been doing?”
Fundamental analysis answers: “What does the company actually represent, beyond today’s chart?”
High-volatility stocks complicate things because price may move far from fundamentals in the short term. Still, fundamentals can matter for longer holds and for spotting whether a move is likely to reverse or continue.
Technical Analysis
Technical analysis uses price movements, patterns, and indicators to estimate future behavior. Traders often rely on chart structures and momentum/mean-reversion signals.
Common tools include:
- Moving averages for trend direction and dynamic support/resistance
- Relative Strength Index (RSI) to gauge overbought/oversold conditions
- Volatility indicators (including ATR) to calibrate stops and targets
For high-volatility stocks, technical levels tend to matter because many traders react to the same support and resistance areas. When enough people place orders around those levels, the levels become self-reinforcing.
What technical analysis can help you do
A good technical framework can help you:
- Plan entry points that match your strategy (breakout vs. pullback)
- Define invalidation levels for stops
- Set realistic targets based on historical movement
- Avoid trading when volatility is “out of character” for that stock
And yes, sometimes it helps you avoid bad trades too—like buying a “dip” that keeps dipping because the chart structure never stabilized.
Fundamental Analysis
Fundamental analysis tries to estimate a company’s intrinsic value. In volatile stocks, fundamentals can get buried by sudden changes in sentiment, but they can still matter in three ways:
- Quality check: helps you avoid low-quality businesses that collapse under stress
- Thesis alignment: ensures the trade idea matches the business outlook
- Reversion logic: if price is temporarily outrunning value, fundamentals can support longer-term recovery assumptions
Core areas include:
- Financial health (cash flow, debt, margins)
- Earnings quality (are profits real or just accounting optics?)
- Revenue growth and guidance reliability
- Competitive position and management execution
Example: earnings volatility doesn’t mean fundamentals don’t matter
Let’s say a stock drops 15% after earnings. Technically, you may see oversold conditions and a support level forming. But fundamental analysis might reveal that the miss wasn’t random—it could reflect shrinking demand, weakening margins, or a balance-sheet stress. In that case, the stock can remain volatile to the downside even if the chart briefly looks “cheap.”
On the other hand, if the earnings beat but the company also raised guidance and the sell-off seems driven by confusion or temporary expectations, fundamentals suggest the volatility might calm down after the market digests the news.
The lesson: treat technical signals as timing tools; use fundamentals to decide what kind of volatility you’re dealing with.
Staying Informed and Adapting Strategies
High-volatility trading is partly a skills test and partly a “staying awake” exercise. Events drive movement. If you trade volatile stocks, you need to know what event calendar items are near and what types of news tend to move your specific names.
What to monitor for volatile stocks
Different stocks react to different triggers. Still, most volatility falls into a few repeatable categories:
- Earnings calendar: scheduled results and guidance updates
- Macro releases: inflation reports, employment data, rate announcements
- Policy or regulatory news: changes that affect specific industries
- Geopolitical developments: risk spikes and supply-chain impacts
- Company-specific catalysts: contracts, lawsuits, product launches, mergers
If you don’t monitor these, you risk placing trades at the worst possible time—like going long right before a report you didn’t plan for.
News is useful, but don’t let it hijack your plan
It’s tempting to trade every headline. That’s how you end up in a loop of random entries and exits driven by emotions. Better idea: treat major news as information for adjusting your thesis and risk settings, not as a reason to abandon them mid-trade.
A disciplined approach looks like:
- Check upcoming events before you enter
- Decide whether you want to hold through them
- If yes, reduce position size or widen risk targets appropriately
- If no, stay flat until the event passes
You can still trade actively without letting every alert turn into a new strategy.
Using financial news sources
There are plenty of reliable finance updates out there. Platforms like Bloomberg, Reuters, and CNBC provide regular updates and expert analyses that can assist you in making more informed decisions.
But it helps to use them in a structured way. For example, rather than reading everything all day, you might:
- Check scheduled earnings and macro releases once in the morning
- Review overnight updates before the open
- Track what actually moved prices after events
Over time, you’ll learn which types of headlines matter and which are mostly noise.
Adapting strategies when volatility shifts
Volatility isn’t constant. A stock may behave calmly for weeks, then suddenly become jumpier due to a new catalyst. The market can also shift regimes: risk-on becomes risk-off, and high-beta stocks move differently.
So your strategy has to adapt. That doesn’t mean reinventing everything every week. It usually means adjusting settings such as:
- Stop-loss distance based on current ATR or range
- Position size if volatility increases
- Time horizon (day trade vs. swing trade)
- Whether you trade breakouts or wait for pullbacks
If volatility doubles and you keep using the same stop placement and share size, you may not notice the problem until your loss streak starts writing its own autobiography.
Putting It Together: A Practical Trading Workflow
High-volatility trading works best when you combine analysis and risk controls into a repeatable routine. Here’s a straightforward workflow many traders follow, adjusted for volatile names.
Step 1: Identify what kind of volatility you’re dealing with
Ask: is the volatility driven by earnings cycles, liquidity conditions, or macro sensitivity? A biotech stock after an FDA deadline behaves differently from a large tech stock during rate shocks.
If you know the likely “why,” you can choose the right risk approach.
Step 2: Use technical levels to plan entry and invalidation
Pick the trade setup you’re comfortable executing. Examples:
- Breakout trades above resistance, with stops below the breakout level
- Pullback trades toward support, with stops below the structure
- Mean reversion trades at extremes, with targets nearer the mid-range
The goal is not to predict perfectly. It’s to define where your thesis breaks.
Step 3: Size the position based on stop distance and max risk
Once you set your invalidation point, calculate position size so that a stop-out fits your max risk per trade.
With high-volatility stocks, this is where traders either stay consistent or start gambling.
Step 4: Place the trade with awareness of timing risks
If an earnings release is near, decide whether you still want the position. If yes, consider reducing size. If no, consider waiting until after the event.
Volatility often spikes around known dates, not just random times.
Step 5: Manage the trade using rules, not feelings
Common rule types:
- Move stop to reduce risk once the trade moves in your favor
- Take partial profits at logical targets
- Exit early if price action no longer supports your setup
- Apply a time stop if the move doesn’t happen
Rules keep the trade from turning into a long argument with your own brain.
Step 6: Review what happened and adjust
After the trade, check:
- Did the stock respect your levels?
- Was your stop logical or just hopeful?
- Did news timing matter more than you assumed?
- Was your position size appropriate for the volatility?
This is the “boring” part that actually makes you better.
Common Mistakes Traders Make with High-Volatility Stocks
If you’re going to trade volatile stocks, you’ll probably run into these. The trick is catching them early.
Using stops that are too tight
A tight stop might look disciplined, but in volatile names it can turn normal noise into constant exits. You end up paying the spread and missing the real move.
If your stop triggers more often than it “should,” recalibrate using historical range or ATR.
Oversizing positions
Volatility makes it easy to accidentally take too much risk. Your stop might be correct, but if your position size is too large, a normal losing streak can break your account.
Position sizing isn’t paperwork—it’s survival.
Ignoring event risk
Some traders enter and forget that the next day includes earnings or a major macro release. If your strategy doesn’t plan for gaps, you’ll be surprised when price jumps right through your stop.
If you don’t want overnight risk, don’t carry positions into known catalysts.
Confusing excitement with a valid thesis
Volatile stocks can feel exciting because movement happens fast. But excitement doesn’t replace reasoning. If you don’t know what would make you correct (or wrong), you’re essentially flipping a coin dressed up as technical analysis.
How Risk Management Looks by Trading Style
Risk management isn’t one-size-fits-all. High-volatility exposure behaves differently for different time horizons.
Day traders
Day traders focus on intraday price movement and often rely on tighter stops and faster decisions. That means:
- Slippage and spread matter more
- News timing (big releases) can dominate the session
- Daily loss limits help prevent revenge trading
Swing traders
Swing traders hold through multi-day volatility. That means:
- Overnight gaps are more likely
- Stop placement must factor in typical daily ranges
- Event calendars are harder to ignore
Longer-term investors in volatile names
Some investors hold volatile stocks longer, typically because they believe the business value will win over time. For them:
- Position sizing still matters, because drawdowns can be large
- Fundamentals and thesis durability matter more than intraday charts
- Risk may show up in debt, liquidity, or dilution rather than daily price swings
Different horizons, different types of risk. Same need for planning.
Conclusion
Involvement in high-volatility stocks requires a comprehensive approach to risk management. Diversification, position sizing, and stop-loss planning are the practical tools that keep your account from being one bad day away from chaos.
On top of that, using both technical and fundamental analysis helps you decide what to trade and why. Technical analysis supports timing and invalidation levels, while fundamental analysis gives context for whether a price move looks temporary or structural. And since high-volatility stocks respond quickly to news, staying informed and adapting your strategy when conditions change matters just as much as the trade itself.
Risk management isn’t a one-time event—it’s ongoing. Volatile markets evolve, and your rules should evolve with them. When you balance potential gains against the real risks of fast-moving stocks, you don’t eliminate volatility (you can’t). You just stop volatility from controlling your outcome.
Achieving this balance takes discipline. You’ll likely be wrong sometimes, because markets enjoy that hobby. But if your risk controls stay consistent, the wins and losses will remain part of a system, not a surprise attack.