
Understanding Volatility Regimes
Volatility in financial markets refers to the degree and frequency of price fluctuations over a given period. It is commonly measured by the dispersion of returns and reflects the uncertainty or variability embedded in asset prices. Volatility is not constant. Instead, markets tend to transition between distinct periods characterized by relatively stable price movements and periods marked by sharp, unpredictable swings. These transitions are commonly described as volatility regimes.
Recognizing and adapting to volatility regimes is fundamental to portfolio construction, capital preservation, and long-term investment performance. Position sizing, in particular, plays a central role in managing risk when market conditions shift. Adjusting the amount of capital allocated to a single position can help control exposure without necessarily altering the broader investment thesis.
Volatility regimes influence not only price behavior but also liquidity, correlations between assets, execution risk, and the effectiveness of certain trading strategies. A systematic approach that incorporates volatility regime identification into risk management frameworks allows investors to respond in a structured and consistent manner rather than through reactive decision-making.
Characteristics of Volatility Regimes
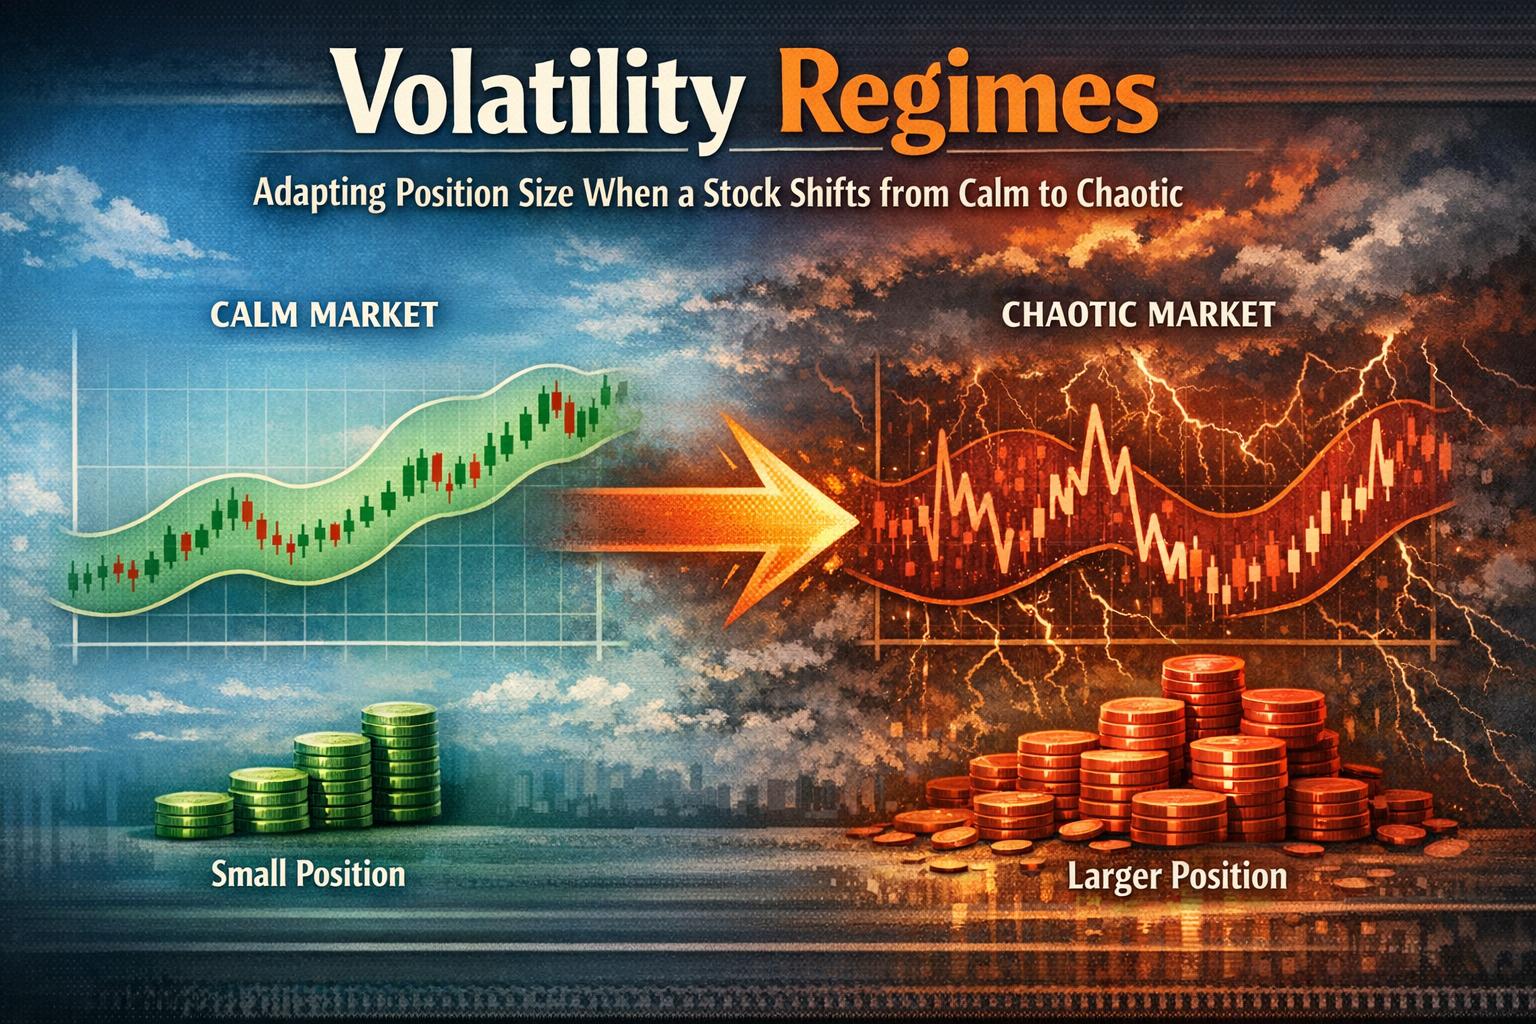
A calm volatility regime is typically associated with relatively small daily price movements, narrow trading ranges, and stable correlations across asset classes. During these periods, macroeconomic conditions are often predictable, monetary policy may be stable, and market participants exhibit moderate risk tolerance. Bid-ask spreads tend to be tighter, and liquidity is generally sufficient to accommodate standard position sizes without significant price impact.
In contrast, a chaotic volatility regime is defined by large and rapid price changes, widening spreads, increased trading volume, and shifting correlations between assets. These regimes are often observed during periods of economic uncertainty, geopolitical instability, financial stress, or sudden macroeconomic re-pricing. Market participants may respond quickly to new information, producing amplified price reactions and increased speculative behavior.
It is important to note that volatility regimes are not binary states but exist along a spectrum. Transitional phases often occur, where volatility begins to expand gradually before reaching more extreme levels. Similarly, elevated volatility may contract progressively as markets stabilize. Identifying these transitions early can allow for proactive adjustments in portfolio positioning.
Indicators of Volatility Shifts
Investors rely on quantitative measures to evaluate current volatility levels and detect regime changes. One commonly used metric is standard deviation, which measures the dispersion of returns around their mean. Higher standard deviation values indicate greater variability and therefore higher volatility.
Bollinger Bands are another frequently used tool. They consist of a moving average and bands plotted at specified standard deviation levels above and below that average. When price movements consistently touch or expand beyond the bands, volatility may be increasing. Narrowing bands, sometimes referred to as a “squeeze,” often precede periods of expanding volatility.
The Average True Range (ATR) measures the average range between high and low prices over a defined period. Unlike standard deviation, ATR specifically captures intraday range fluctuations, making it useful for traders seeking to calibrate stop-loss distances or position sizes relative to recent price behavior.
Additional tools include historical volatility calculations, implied volatility derived from options pricing, and volatility indices that aggregate market expectations. Moving averages of volatility indicators can also help smooth short-term noise and highlight sustained regime changes.
Advanced approaches may include regime-switching statistical models, such as Markov regime-switching frameworks, which estimate the probability that markets are currently in a high- or low-volatility state. While these models are more complex, they offer a structured method of categorizing environments based on observable data.
Adapting Position Size
Position sizing refers to the proportion of capital allocated to a specific investment relative to the overall portfolio. Because volatility directly affects the magnitude of potential gains and losses, adjusting position sizes according to current volatility conditions is a primary risk management technique.
In a calm volatility regime, smaller price fluctuations generally imply reduced short-term risk exposure. Under these conditions, investors may allocate a larger percentage of capital to individual positions while still maintaining predefined risk thresholds. Stops and risk limits can be relatively tighter due to narrower price ranges.
Conversely, in a chaotic volatility regime, price movements may be amplified, and the risk of adverse market moves increases. Maintaining the same position size used in calm conditions can lead to disproportionate losses. Reducing position size in proportion to increased volatility helps maintain consistent risk exposure across different environments.
One practical approach involves volatility-adjusted position sizing. For example, an investor might determine risk per trade as a fixed percentage of portfolio capital—such as 1% or 2%—and then calculate position size based on the distance between entry price and stop-loss level. If volatility expands and the stop distance widens, the corresponding position size is reduced automatically to preserve constant capital risk.
This methodology ensures that exposure remains consistent in risk terms rather than notional dollar value. Over time, such discipline can stabilize portfolio drawdowns and improve the distribution of returns.
Volatility Targeting and Portfolio Construction
Volatility targeting is a systematic method by which portfolio exposure is adjusted to maintain a specific volatility level. This approach is commonly employed in institutional asset management, including risk parity and managed volatility strategies.
Under volatility targeting frameworks, investors increase exposure when market volatility declines and decrease exposure when volatility rises. For example, if a portfolio aims to maintain annualized volatility of 10%, and current measured volatility drops to 5%, leverage or larger position sizes may be used to bring expected volatility closer to target. Conversely, if volatility rises to 20%, exposure is reduced accordingly.
This approach aims to stabilize portfolio risk across varying regimes. However, rapid volatility spikes can challenge rebalancing processes if adjustments lag behind actual market conditions. Therefore, volatility targeting strategies often incorporate smoothing mechanisms and predefined rebalancing frequencies.
Correlation Effects in High Volatility
An important feature of chaotic regimes is the tendency for correlations between assets to increase. Assets that traditionally provide diversification benefits may begin moving in the same direction during stressed conditions. This effect can reduce the protective impact of diversification strategies.
In calm regimes, cross-asset correlations may remain stable or moderate, allowing investors to maintain broader exposure with controlled aggregate risk. During chaotic regimes, correlation shifts can amplify portfolio-level losses if position sizes are not adjusted across holdings.
To manage this effect, investors may monitor rolling correlation matrices and stress-test portfolios under high-volatility assumptions. Position size adjustments may need to reflect not only individual asset volatility but also changing inter-asset relationships.
Liquidity Considerations
Liquidity often deteriorates in chaotic volatility regimes. Wider bid-ask spreads and reduced market depth can increase transaction costs and execution risk. Larger position sizes become more difficult to enter or exit efficiently without influencing market prices.
Reducing position sizes in high-volatility environments can indirectly mitigate liquidity risk. Smaller allocations can be executed more flexibly and with less potential market impact. Monitoring average daily volume and order book depth can provide additional context when evaluating position sizing decisions.
Risk Management Strategies
Effective risk management extends beyond adjusting position sizes. A structured framework integrates multiple tools and techniques designed to limit downside exposure and stabilize returns across regimes.
Diversification: Allocating capital across multiple asset classes, geographic regions, and sectors can reduce reliance on a single source of return. Diversification does not eliminate volatility but can reduce extreme portfolio-level fluctuations under normal correlation structures.
Stop-Loss Orders: Predefined exit levels limit potential losses on individual positions. In chaotic regimes, stop-loss distances should reflect elevated volatility to reduce premature exits due to normal price noise. Trailing stops may also be used to adjust dynamically as trends evolve.
Options Hedging: Protective puts or other hedging strategies can offset downside risk. While hedging introduces additional cost, it may be appropriate during heightened uncertainty. Implied volatility levels should be evaluated carefully, as option premiums often rise in chaotic regimes.
Additional techniques include scaling into positions gradually, maintaining higher cash allocations during extreme volatility, and implementing portfolio-level drawdown thresholds that trigger capital reductions.
Behavioral Considerations
Volatility regimes can influence investor behavior. Rapid price movements may encourage impulsive trading decisions or deviation from predefined strategies. Maintaining a consistent position sizing framework helps reduce behavioral biases by enforcing objective risk constraints.
Documenting entry criteria, exit rules, and volatility thresholds can support disciplined execution. Automated position sizing formulas embedded within trading platforms further reduce the likelihood of inconsistent risk exposure across trades.
Leveraging Technology
Modern trading platforms provide tools that facilitate systematic volatility management. Real-time tracking of standard deviation, ATR, and implied volatility enables continuous monitoring of regime shifts. Customizable alerts can notify investors when volatility metrics breach predefined thresholds.
Algorithmic trading systems may incorporate volatility filters that automatically adjust trade size or temporarily restrict new entries when volatility exceeds acceptable bounds. Backtesting tools allow investors to evaluate how position-sizing rules would have performed during historical calm and chaotic regimes.
Data analytics software can also support scenario analysis, simulating portfolio reactions under alternate volatility assumptions. Such preparation can inform risk controls before market conditions change materially.
Conclusion
Volatility regimes are a structural feature of financial markets. Price variability expands and contracts over time in response to economic developments, policy shifts, and changing investor expectations. Effective investment management requires recognizing these shifts and adjusting risk exposure accordingly.
Position sizing serves as a primary mechanism for aligning portfolio risk with prevailing volatility conditions. By increasing allocation during calm regimes and reducing it during chaotic regimes, investors can maintain consistent capital exposure relative to risk.
Complementary tools—including diversification, stop-loss mechanisms, hedging strategies, liquidity analysis, and technological integration—enhance the effectiveness of this approach. A systematic and data-driven framework allows for objective decision-making and improved risk control across evolving market environments.