
Understanding Volatility and Liquidity in Financial Markets
In financial markets, two terms come up in pretty much every serious conversation: volatility and liquidity. People throw them together because they often move in the same general direction during stress, but they describe different realities. Volatility is about how much prices move. Liquidity is about how easily you can trade without pushing the price around. If you mix those up, you end up with a risk model that looks good on paper and behaves badly in the real world.
For investors and traders, getting the distinction right matters because it touches three practical areas: price formation, trade execution, and risk management. And it comes up across asset classes—equities, bonds, commodities, and currencies—though the details vary a bit depending on how those markets operate.
Defining Volatility
Volatility refers to the degree of variation in the price of a financial instrument over a defined period. In plain English: it measures how “jumpy” the price is. When volatility is high, the instrument tends to experience wider swings—sometimes minute to minute, sometimes day to day. When volatility is low, prices drift within narrower ranges.
Most volatility measures are variations of the same idea: dispersion. In practice, you’ll see volatility defined as:
- Standard deviation of returns (common in risk models)
- Variance (same concept, just another mathematical form)
- Average true range (often used in technical analysis to gauge typical movement)
High volatility doesn’t only mean “higher risk” as a slogan. It also affects how traders behave. Wider price swings attract momentum strategies, increase the frequency of stop-outs, and change hedging costs. If you’re trading options, volatility is basically the weather system that governs the entire pricing model.
What drives volatility?
Volatility spikes for reasons that tend to be common across markets:
Corporate earnings and guidance changes
Macroeconomic data releases (inflation, jobs reports, central bank signaling)
Geopolitical events and policy shocks
Shifts in market expectations—sometimes subtle, sometimes not
A useful way to think about it is this: volatility rises when new information arrives faster than markets can comfortably price it. That can happen during scheduled events (like rate decisions) or unexpected ones (like a sudden regulatory change).
Historical vs. implied volatility
Volatility is often measured using two broad approaches:
- Historical volatility: calculated from past price data. It answers, “How much has it moved recently?”
- Implied volatility: derived from options pricing. It answers, “How much movement is the market expecting going forward?”
Historical volatility is backward-looking and depends on the chosen window length. A 20-day measure might tell a different story than a 60-day measure, especially if volatility regimes change. Implied volatility is forward-looking in the sense that it reflects option market expectations. That said, implied volatility can represent the cost of hedging or speculative pricing more than a clean forecast. Markets rarely agree on what “will happen,” only on what is being priced.
Understanding Liquidity
Liquidity describes how easily an asset can be bought or sold without causing a substantial change in its market price. A liquid market gives you a smoother execution experience: you can trade larger size, at tighter spreads, with less slippage.
In practice, liquidity shows up through several observable features:
- Tight bid-ask spreads: the difference between what buyers pay and sellers ask
- Deep order books: enough orders on both sides at multiple price levels
- Consistent trading volume: stable participation, not just one-off trades
If those conditions hold, an order can be filled with less “price movement caused by your own presence.” If they don’t, liquidity is thinner. Your trades start to move the market, sometimes dramatically for illiquid instruments and in certain hours.
What affects liquidity?
Liquidity doesn’t exist in a vacuum. It depends on:
- Number of active market participants (more participants often means better price support)
- Trading infrastructure and market structure (e.g., centralized exchanges vs. fragmented trading)
- Regulatory environment (rules can affect participation and market-making)
- Overall market conditions (risk-on vs risk-off changes behavior fast)
Institutional investors tend to care about liquidity more intensely than retail traders because their orders are large relative to typical trading volume. Large orders need depth. Without it, the transaction doesn’t just fill—it “walks” the price. That turns a planned trade into a different trade than expected.
Primary vs. secondary market behavior
One more nuance that’s easy to forget: liquidity can behave differently in primary markets (new issuance) compared to secondary markets (trading after issuance). A bond issued today might not trade particularly well later if dealer inventory risk changes or if there’s little demand for that maturity. It’s not always about the asset’s long-term quality; it’s often about who happens to be holding inventory and how eager they are to adjust it.
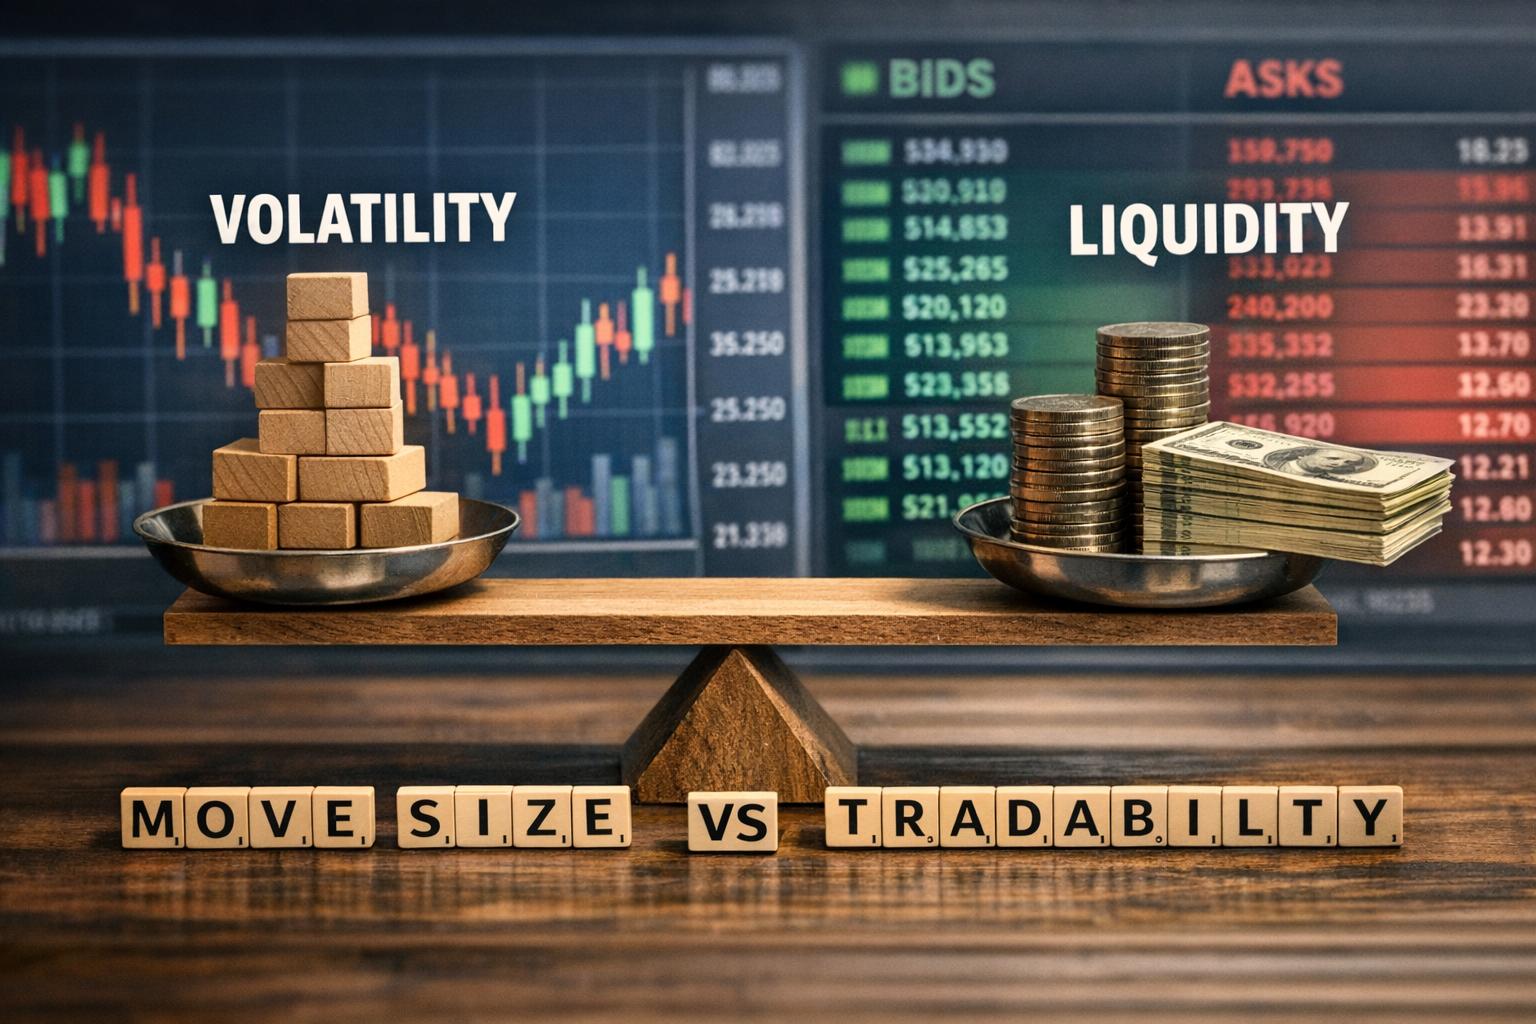
Volatility Isn’t Tradability
Here’s a misunderstanding that shows up all the time: high volatility automatically equals a great trading opportunity. It’s a tempting thought because big price moves feel profitable. But volatility is not the same thing as tradeability.
You can have an asset that moves a lot but is annoying to trade. In that case:
- Bid-ask spreads may be wide
- Order book depth may be thin
- Slippage can eat your edge
- Stops might trigger from noise rather than a real breakdown
On the flip side, an asset can be stable (low volatility) and still be a pleasant instrument to trade—especially if it’s liquid and spreads are tight.
Put differently: volatility speaks to price behavior. Liquidity speaks to execution friction. A strategy needs both the right kind of price movement and a market structure that lets you capture it without paying too much in the form of transaction costs and adverse selection.
Real-world example
Imagine two stocks:
Stock A has occasional 5–8% swings intraday, but the spreads widen when news hits and volume thins out between headlines.
Stock B moves more calmly—say 1–2% swings—but it trades steadily with tight spreads and strong depth.
If you’re running a short-horizon strategy that depends on expected execution quality, Stock A might be “tempting on paper.” In reality, your fills may be worse than you assume, and your effective risk/reward can shrink fast after you account for costs. Stock B can outperform simply because trading it behaves like trading should: consistent and measurable.
Interaction Between Volatility and Liquidity
Volatility and liquidity interact in a way that often makes intuitive sense. When markets calm down, uncertainty falls and participation improves. When fear rises, participants demand more compensation for taking risk and trade less freely.
During market stress, you commonly see:
- Volatility rising as returns widen
- Liquidity contracting as bid-ask spreads widen
- Order books becoming thinner because market-makers reduce inventory exposure
This relationship isn’t always one-directional, but it’s frequent enough that traders plan for it. Liquidity doesn’t just disappear randomly; it tends to evaporate when people stop wanting to hold risk.
In calmer periods, liquidity often improves and price changes become more measured. Order books refill, spreads narrow, and trading costs drop. The market feels “cleaner,” and many strategies recover their expected performance because execution becomes closer to theoretical assumptions.
How this shows up in prices
When liquidity decreases and volatility increases at the same time, the price can do something uncomfortable: it can move in larger steps. That can be visible as larger gaps between trades, less orderly progression through price levels, and higher probability of overshooting your intended fill.
There’s also a secondary effect: when liquidity thins, it becomes harder to arbitrage mispricings quickly. That can make volatility persist longer than expected, especially when participants disagree and trading slows down.
Implications for Risk Management
If you only track volatility, you may still get blindsided by the execution and loss mechanics that come from low liquidity. If you only track liquidity, you can still take unmanaged risk during price shock events.
Recognizing the distinctions and interaction between volatility and liquidity helps you do several practical things better:
- Position sizing: scale size not just to volatility, but to the liquidity you can actually trade
- Execution planning: choose order types and timing consistent with market depth and spreads
- Stop and limit logic: avoid assuming you’ll get the fill you want under stress
- Risk controls: include transaction costs and market impact in the “real” loss estimate
A lot of “risk” in trading is not strictly about price direction. It’s about the path you take to get in and out, and whether that path stays close to what your backtest assumes.
Volatility and Liquidity Across Asset Classes
The core concepts apply everywhere, but the expression differs.
Equities
In equities, liquidity often relates to:
Listing venue and market microstructure
Average daily volume
Presence of market makers or active investors
Bid-ask behavior around news
Volatility tends to rise around earnings, macro events, and large system-wide shocks. In highly liquid indexes, volatility might not look extreme relative to the index. Still, individual stocks can have sharp volatility changes because their order flow is more concentrated around specific events.
Bonds
Bonds can be less liquid in practice, even when they appear “major.” Many bond markets rely more heavily on dealer inventory and can have wider spreads, thinner depth, and more uneven pricing across maturities. You might see volatility shift in yield changes and spread widening, while liquidity varies significantly by tenor, credit quality, and issuance size.
A bond can stay relatively stable in terms of headline moves but still be tricky to trade if depth fades when you need it most.
Commodities
Commodity markets include variables like storage costs, futures contract roll dynamics, and supply shocks. Liquidity can differ across contract months. Volatility can spike based on weather, geopolitics, or production disruptions, and trading conditions may worsen when speculative participation drops or hedgers adjust quickly.
If you’ve ever watched a futures curve flinch, you know volatility isn’t just about the front contract. It can ripple through the curve as expectations shift.
Currencies
In FX, liquidity is generally high for major pairs, but conditions still change during specific sessions and events. Spreads can widen during certain liquidity troughs (often tied to time-of-day and regional trading patterns), and volatility can jump around central bank decisions.
Currency volatility can be influenced by changes in interest rate expectations, risk sentiment, and sudden flows. Liquidity can be influenced by who’s active at that time and how risk appetite behaves.
Measuring Volatility and Liquidity in Practice
Most people understand volatility conceptually, but measurement approaches often vary. The same goes for liquidity.
Common volatility measures
Typical tools include:
Standard deviation of returns (for modeling and risk metrics)
Rolling-window volatility (to see regime changes)
Implied volatility from options (for expectation and hedging costs)
Average True Range (ATR) in technical frameworks
It’s worth being a little careful with windows and scaling. A 30-day volatility estimate can lag a regime shift. A 5-day measure might react quickly but be noisy. Many traders and risk managers use multiple horizons.
Common liquidity measures
Liquidity metrics vary depending on whether you want something that’s operational (for execution) or analytical (for risk models). Common ideas include:
- Bid-ask spread (average and distribution)
- Trading volume and turnover
- Order book depth at multiple levels
- Market impact estimates (how price moves in response to trade size)
- Time-to-fill and fill rate (especially for limit orders)
The subtle point: some liquidity measures are static averages; others are conditional. Spreads might average narrow but blow out around events. Depth might look fine most days but disappear at specific times. Good measurement tries to capture the situations where you actually trade.
Execution Costs: Where Liquidity Meets Your Profit Model
Whenever someone says “volatility is high, so returns should be high,” I gently remind them about execution costs. Volatility doesn’t pay you automatically. You pay the market to enter and exit, and you pay for the difference between your intended and actual fill.
Execution costs come from:
Bid-ask spreads
Slippage (difference from expected price)
Market impact (price movement caused by your order)
Adverse selection (trading against better-informed participants)
Liquidity affects all of the above. When liquidity falls, spreads widen and market impact rises. This can make a strategy that looks profitable on paper turn unprofitable in live trading.
A simple way to frame it
If you trade a liquid asset, your expected execution price might be close to the mid-price plus a small adjustment. If you trade an illiquid asset, your execution price can drift far from mid, especially for larger sizes or urgent orders.
This is why sophisticated traders talk about “implementation shortfall.” It’s basically: how much performance you lose between decision and execution.
Volatility Regimes and Liquidity Regimes
Markets don’t stay in one mood indefinitely. Volatility changes over time in regimes. The same is true for liquidity.
A “regime” can mean:
A sustained period where volatility is higher than usual
A market stress period where liquidity systematically contracts
An earnings season window with predictable event clusters
When regimes shift, simple models built on historical averages can break down. That’s why risk managers consider stress scenarios rather than only routine conditions.
Common stress pattern
The typical stress pattern is “more volatility + less liquidity.” It’s inconvenient because many portfolios depend on being able to hedge or rebalance. If hedging instruments become illiquid at the same time volatility rises, you can’t respond quickly enough, and losses compound.
This is one reason liquidity risk deserves its own attention rather than being treated as a footnote after volatility.
Portfolio Construction: Using Both Metrics Without Overcomplicating It
You don’t need a PhD in market microstructure to benefit from the volatility/liquidity distinction. You do need to avoid the habit of treating them as interchangeable.
Position sizing that respects liquidity
Even if your risk model says you can hold a large position based on volatility alone, liquidity may force smaller size in practice. A useful rule of thumb is to estimate whether your order size would consume a meaningful portion of available depth—especially during the times you trade.
If your trade repeatedly pushes against the book, your actual risk becomes larger than expected.
Correlation and risk interactions
Volatility and liquidity also affect correlations. In stress, correlated moves often become more intense. Meanwhile, liquidity constraints can prevent trades that would normally reduce risk through diversification or hedging. That changes the risk profile even if your “static” correlations look reasonable.
So yes, correlation matters. But when correlation rises while liquidity falls, the stress can be extra ugly.
Rebalancing behavior
Rebalancing helps control risk, but only if you can do it cheaply and on schedule. Liquidity influences the feasibility of rebalancing. If spreads widen and spreads widen right when you need to trade, your rebalancing becomes “selective,” and the intended risk reduction may not happen.
Institutional portfolios that rely on scheduled rebalancing often incorporate liquidity forecasts or use trading windows to reduce cost. Retail traders do this less formally, but the pain is similar.
Common Scenarios Where People Get It Wrong
It’s useful to list the failure modes that show up repeatedly.
Confusing “price movement” with “trade execution”
Someone identifies a high-volatility asset and assumes it’s easy to trade that volatility. Then they discover the spreads are wide when the moves happen most. The result: profits get eaten by costs during the exact moments the strategy expects to do well.
Assuming liquidity today equals liquidity tomorrow
Liquidity is conditional. Event-driven markets can change their structure quickly. A market can be liquid most days and temporarily become hostile when volatility rises. If your strategy doesn’t account for that conditional shift, you end up trading blind.
Ignoring the size problem
Small trades can look fine in illiquid instruments. Large trades reveal the truth. Many traders learn (usually the expensive way) that order size relative to depth matters more than average volume.
Practical Tips for Better Decision-Making
Below are practical methods traders and investors use to separate volatility and liquidity thinking, without making it an academic exercise.
Check volatility and liquidity around the events you actually care about
If you trade around earnings, look at volatility and spreads in those windows. Don’t only check average conditions. Execution quality during event windows can differ a lot from “normal days.”
Use liquidity-adjusted assumptions in backtests
Backtests often assume you can trade at predictable prices. That’s fine for textbooks and less fine for real markets. Incorporate realistic spreads and slippage estimates, and adjust them for liquidity conditions.
If you backtest a strategy with constant friction, you may underestimate losses in high-volatility periods.
Stress-test both the price path and the ability to exit
A portfolio can lose money because prices go down. It can also lose money because you can’t exit cheaply. Liquidity stress needs to be part of the simulation.
In other words: stress the exit, not only the entry.
FAQ: Quick Clarifications
Is volatility the same as risk?
Volatility often correlates with risk, but it’s not identical. Risk includes the consequences of not just price movement, but also execution, liquidity, leverage, and position size relative to market depth. Two assets with the same volatility can behave very differently when you try to trade them.
Can an asset be liquid but volatile?
Yes. Liquid markets can still experience high volatility, especially during scheduled events or macro shocks. Liquidity tells you execution quality; volatility tells you price variability. One doesn’t cancel the other.
Does low liquidity always mean high volatility?
Not always, but the relationship often appears during stress. Low liquidity increases the sensitivity of prices to trades, which can contribute to volatility. Still, liquidity can be low without dramatic price swings if participation is stable.
What should I prioritize: volatility or liquidity?
If you trade, you prioritize what you actually need. If you trade size frequently, liquidity matters more than many people initially think. If you hold and only reassess occasionally, volatility matters more. Most investors ultimately care about both, because liquidity affects how you can respond when volatility changes.
Putting It Together: Why the Distinction Matters
Understanding the differences between volatility and liquidity is more than vocabulary. It changes how you interpret charts, how you plan orders, and how you manage risk when markets throw surprises at you.
Volatility answers: “How much can prices move, and how erratic are those moves likely to be?”
Liquidity answers: “How hard is it to trade without creating an expensive mess for yourself?”
And in stress, the two often share a bad habit: prices get wilder while liquidity gets thinner. If you recognize that interaction early, you can structure your portfolio allocation, position sizing, and execution approach with fewer assumptions and fewer surprises—always a good thing, unless you’re trying to make the market laugh at your expense.